Trying to grow your business without tracking client engagement is like driving with your eyes closed, but the solution is simpler than you think: automate the tedious parts so you can focus on the numbers that matter. With a tool like PostOnce to handle cross-posting your content, you free up the time to make sharp, data-backed decisions that actually move the needle. You can stop guessing.
When you use PostOnce to get your content out on platforms like Threads, BlueSky, and LinkedIn, the manual labor of posting disappears. Suddenly, you have the time to look at the numbers that tell you what’s really going on with your audience. Think of these metrics as the vital signs for your brand’s health—they tell you how people are behaving and what they're likely to do next.
Your Guide to Tracking Client Engagement Metrics

This guide is your playbook. We're going to turn those jumbles of audience interactions into a predictable engine for growth. We’ll cut through the fluff—all those vanity metrics that look good but mean nothing—and focus on the numbers that actually predict customer loyalty and boost your revenue.
Consider this your roadmap. We'll start with the basics and work our way up to more advanced strategies that tie every like, comment, and share directly to your bottom line. You'll learn how to read your data and make confident moves, all while PostOnce handles the tedious cross-posting in the background.
What Are Client Engagement Metrics?
At its heart, client engagement is all about the quality and frequency of the interactions a customer has with your brand. Client engagement metrics are simply the hard numbers we use to measure those interactions. We're talking about more than just likes and follows; these are the real indicators of how deeply your audience is connecting with what you have to say, sell, or offer.
To get the full picture, you need to look at a few different kinds of data:
- Active Interactions: These are the obvious ones—comments, shares, direct messages, and clicks. Someone is taking a direct action.
- Attention Metrics: This is about time. How long are people sticking around? Think average session duration on your website or how much of a video they actually watch.
- Loyalty and Satisfaction: These metrics, like your Net Promoter Score (NPS) or customer retention rate, give you a pulse on the long-term health of your brand relationships.
If you’re a creator, for example, getting comfortable with a platform's built-in tools is a must. It's how you can unlock your channel's potential with YouTube video analytics and see what's truly working.
A high engagement rate is a signal. It tells you that your content and your offers are hitting the mark with the right people, at the right time.
By keeping an eye on these numbers, you stop talking about fuzzy ideas like "brand loyalty" and start dealing with cold, hard data you can actually use. You can finally stop guessing what your audience wants and start giving it to them with precision. The goal is a simple feedback loop: data informs your strategy, and your strategy drives even better engagement.
How PostOnce Solves the Search for Engagement Metrics
When people search for "client engagement metrics," they aren't just looking for definitions. They're looking for a reliable way to measure and improve how they connect with their audience to grow their business. You can have all the analytics tools in the world, but if you're not consistently putting out content, you won't have any meaningful data to analyze in the first place.
This is exactly where PostOnce fits in.
It automates the soul-crushing task of posting the same content across different platforms, making sure you have a consistent presence everywhere that matters. That consistency is the bedrock of good data. You can easily test what works on Instagram versus LinkedIn without spending your entire day uploading posts.
PostOnce takes care of the distribution grunt work, freeing you up to focus on what this guide is all about: analyzing the numbers that truly matter.
Why Client Engagement Is Your Most Valuable Asset

Let's be honest: in business, it's easy to get lost in sales numbers and conversion rates. But what if I told you there's a set of metrics that acts like a leading indicator for all of those things? That's client engagement.
Think of engagement as the pulse of your business. It tells you how healthy your brand's relationship is with its audience, predicting everything from customer loyalty to how likely you are to lose someone to a competitor.
Running a business without tracking engagement is like trying to sail a ship with no compass. You're moving, but you have no idea if you're headed in the right direction. The data from clicks, comments, and shares gives you that direction, showing you exactly what’s working so you can double down on it.
Engagement Predicts Future Success
An engaged customer is an invested customer. They're not just passively scrolling past your content; they're stopping to read, react, and share. That active participation is one of the strongest predictors of future revenue.
The data backs this up. Research consistently shows that even a small bump in customer retention—often just 5%—can boost profits by anywhere from 25% to 95%. Why? Because engaged, loyal customers buy more, more often, and become your best salespeople through word-of-mouth.
In essence, tracking engagement is about moving from a reactive to a proactive business model. Instead of waiting for sales to dip, you can spot early warning signs of disinterest and act before customers churn.
This shift allows you to get ahead of problems, anticipate your customers' needs, and build a community that feels truly valued. That kind of relationship is your best defense against whatever the market throws at you.
The Foundation of Stronger Relationships
At its heart, engagement is really just a conversation. Every like, every comment, every share is a customer giving you feedback on what they care about and what problems they need solved. Ignoring those signals is like turning your back on someone speaking directly to you.
High engagement is proof that you're providing real value, not just noise. It tells you that your content strategy is on the right track and your message is connecting with the right people. This creates a powerful, self-reinforcing cycle:
- You Share Something Useful: Your content solves a real problem for your audience.
- Clients Respond: They like, comment, and share, telling you (and the algorithms) that this is good stuff.
- Platforms Boost Your Reach: Social networks see the high engagement and show your content to more people.
- Trust and Authority Build: As more people see your valuable content, your brand's credibility grows, attracting new followers and potential customers.
By focusing on these interactions, you're doing more than just chasing numbers on a dashboard; you're building a real community. For more ideas on how to do this, check out our guide on how to increase customer engagement.
The Financial Impact of High Engagement
The line between high engagement and a healthy bottom line is surprisingly direct. Customers who feel connected to your brand are far more likely to make repeat purchases, try new products, and even forgive the occasional slip-up. They see you as a partner, not just another company trying to sell them something.
This all ties back to Customer Lifetime Value (CLV)—a crucial metric that estimates the total revenue a single customer will bring in over time. Consistently high engagement is one of the most reliable ways to drive that number up.
That's why focusing on client engagement metrics isn't some "soft" marketing task. It’s a core business strategy with a clear, measurable return on investment. It's how you turn casual followers into loyal advocates who fuel your growth for years to come.
The Essential Client Engagement Metrics to Track
Trying to track client engagement metrics can feel like drinking from a firehose. You’ve got dozens of data points flooding in from social media, your website, and email campaigns, and it's incredibly easy to get lost in the noise. The secret isn't tracking everything. It's about focusing on the numbers that tell you how your audience actually thinks and behaves.
Think of these metrics as the language your customers use to communicate with you. They show you what content they love, which products they're curious about, and exactly where they might be losing interest. Once you learn to speak this language, you can stop making assumptions and start making confident, data-backed decisions that truly grow your brand.
Social Media Engagement Metrics
For most businesses today, social media is the front line of client interaction. Engagement on these platforms is a direct pulse check on your brand's health and whether your content is hitting the mark. The most important metric to start with is the Engagement Rate.
This single number tells you what percentage of people who saw your post bothered to interact with it. It’s a brutally honest indicator of how compelling your content really is.
- Formula: (Total Interactions [Likes + Comments + Shares] / Total Impressions) x 100
- Example: A LinkedIn post gets 5,000 impressions, 150 likes, 40 comments, and 10 shares. Your engagement rate is (200 / 5,000) x 100 = 4.0%.
- What It Reveals: This metric tells you if your content genuinely resonated. A high rate means you’ve struck a chord, while a low one is a clear sign your message isn't connecting.
Remember, what's "good" varies wildly. Benchmarks for 2026 are all over the map depending on the platform. For example, marketing agencies are seeing an average of 3.7% on LinkedIn but 3.4% on Instagram. To get a better feel for these platform-specific numbers, check out the latest insights on average engagement rates from Buffer. You can also go deeper by reading our comprehensive guide on other crucial social media metrics.
Website and On-Site Behavior Metrics
Your website is your digital storefront. How people act when they're there gives you invaluable clues about how interested they really are. Two of the most revealing client engagement metrics are Average Session Duration and Pages per Session.
Average Session Duration is exactly what it sounds like: how long, on average, a visitor sticks around during a single visit. A longer session is a strong signal that your content is valuable and holding their attention.
- Formula: Total Duration of All Sessions (in seconds) / Total Number of Sessions
- Example: If 1,000 sessions in a month added up to 1,800,000 seconds (or 500 hours), your average session duration is 1,800 seconds, or 30 minutes.
- What It Reveals: This metric shows how engaging your site is. A low duration might point to a poor user experience, irrelevant content, or a gap between what they expected and what they found.
A visitor who spends five minutes on your blog is far more engaged than someone who bounces after five seconds. Time is a clear currency of interest.
In the same vein, Pages per Session tracks how many different pages someone clicks through before they leave. This helps you understand if visitors are exploring what you have to offer or just hitting a single page and bouncing. A higher number is a great sign that they're curious and finding your content well-connected and useful.
Email and Customer Loyalty Metrics
Moving away from public platforms, your direct channels like email offer a more personal, and often more powerful, set of engagement signals. The king of these metrics is the Click-Through Rate (CTR).
CTR measures the percentage of people who not only opened your email but were compelled enough to click on a link inside it. It’s a much stronger sign of real engagement than open rates alone because it requires a specific, deliberate action.
- Formula: (Total Clicks / Number of Delivered Emails) x 100
- Example: You send a newsletter to 10,000 subscribers, and 800 people click a link. Your CTR is (800 / 10,000) x 100 = 8%.
- What It Reveals: A high CTR is proof that your email copy and call-to-action were persuasive enough to make someone act.
Finally, if you want a more holistic, long-term view, the Customer Health Score is a more advanced metric worth exploring. It bundles multiple data points—like how often someone uses your product, their support ticket history, and survey feedback—into a single score. This gives you a predictive snapshot, helping you see which customers are happy champions and which might be at risk of leaving, so you can step in before it's too late.
How to Set Realistic Engagement Benchmarks
"So, what's a good number for my client engagement metrics?"
It's the question every marketer asks, but the answer isn't a single magic number. Setting realistic benchmarks is less about chasing some universal average and more about knowing your own audience, your industry, and the platforms you're playing on.
Trying to compare your engagement on a B2B LinkedIn post to a viral TikTok dance is like comparing apples to oranges. They live in completely different worlds with totally different audience expectations. Your real goal isn't to beat some random industry average; it's to find a baseline that makes sense for your business and then get a little better, consistently, over time.
This chart gives you a quick visual on the key metrics we're talking about benchmarking.
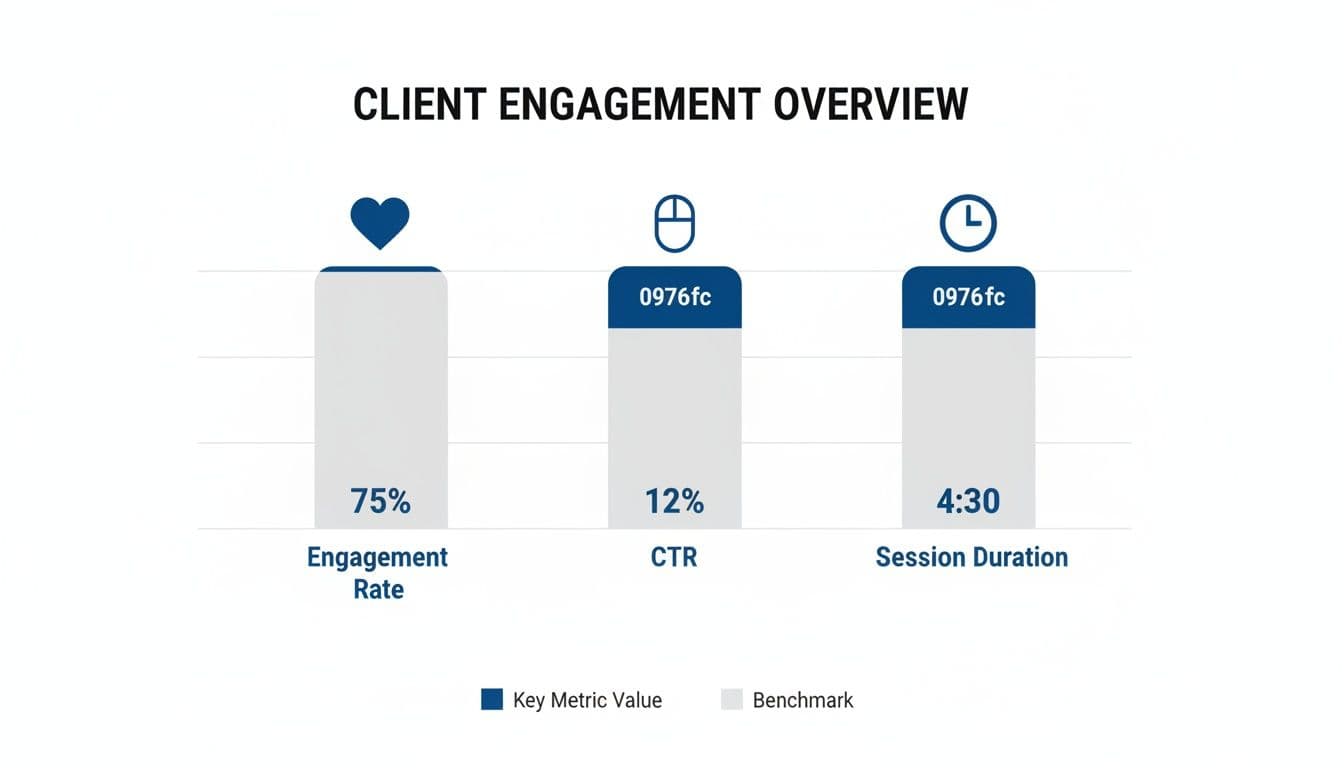
You can see how things like Engagement Rate, Click-Through Rate, and Session Duration are separate metrics, but they all work together to paint a picture of how interested your audience truly is.
Getting a Feel for Industry Averages
Before you can set your own goals, you need to know what the competitive landscape looks like. Industry benchmarks give you a realistic starting point and help you understand what's generally possible in your niche. A highly visual industry like fashion is naturally going to have different engagement patterns than a technical B2B software company.
Right now, the average engagement rate across major social platforms is somewhere between 1.4% and 2.8%. But that number can be misleading because it varies so much from one network to the next.
Instagram and TikTok often have the highest per-post engagement, while LinkedIn is the king of B2B interaction. For example, recent data shows LinkedIn image posts can reach a 14.4% engagement rate, and documents can hit an incredible 37%. Meanwhile, Instagram hovers around 3-6% and TikTok at 4.86%, which really drives home how much your platform choice matters. You can find more insights in these 2025 social media statistics to see the full breakdown.
Remember, these numbers aren't rules—they're just reference points. If your rates are way lower, it might be a sign that your content strategy isn't connecting. If you're beating them, you know you're doing something right.
The Power of Internal Benchmarking
While industry averages are a nice starting point, your most important competitor is the you from last month. Internal benchmarking means tracking your own performance over time to set a baseline that’s completely unique to your brand and your audience. This is where real, sustainable growth comes from.
Think of it this way: an external benchmark tells you where the finish line is for everyone else. An internal benchmark tells you how much faster you're running today compared to last quarter. It automatically accounts for all the things unique to your business—your specific audience, your brand voice, and your content style.
Your past performance is the most reliable predictor of your future potential. Focusing on beating your own numbers week after week is a more powerful growth strategy than chasing a generic industry figure.
To get started, just track your key metrics—engagement rate, CTR, session duration—on a weekly or monthly basis. After a couple of months, you'll have a clear picture of your normal performance, including the natural highs and lows. That average becomes your internal benchmark, the number you’re always trying to beat.
Setting Platform and Content-Specific Goals
To get even more dialed in, break down your benchmarks by platform and even by content format. Your goals should play to the unique strengths of each.
- LinkedIn: You might aim for a higher benchmark for shares on insightful articles or documents, since the audience there values professional, shareable content.
- Instagram: Here, you might prioritize saves on carousel posts or comments on Reels, as those actions signal that users find your content genuinely valuable.
- Website Blog: For your own site, a great benchmark could be increasing the average session duration by 15% each quarter, proving your content is getting stickier.
When you set these kinds of granular goals, you can build a much sharper, more effective content strategy. It directly connects your day-to-day engagement efforts to performance, which is a huge step in understanding your marketing's true impact. You can also learn more about how to calculate marketing ROI in our complete guide on the topic. This approach turns a vague wish like "increase engagement" into specific, measurable targets that actually move the needle.
Turning Metrics into Momentum with PostOnce
After digging into your client engagement metrics, you start to see the patterns. You know which platforms are actually working and what kind of content makes your audience tick. But knowing is only half the battle. The real work is in the execution, and that’s where things can get messy. This is exactly where a tool like PostOnce comes in. Instead of getting tangled up in the manual grind of tweaking and posting to every single network, you can automate your entire distribution.
Let’s think about a real-world example. Say your data shows that deep-dive carousel posts kill it on LinkedIn, but over on Instagram, it’s all about a single, stunning image that gets the comments rolling. The old-school approach? You’d be creating two different posts, fighting with image resizers, and scheduling them one by one. It’s slow, tedious, and a recipe for mistakes.
With PostOnce, you build your core content just once. Then, you set up a few smart rules for cross-posting, and the tool does the heavy lifting.
From Insight to Automated Action
PostOnce is the bridge that connects your data to your daily workflow. It makes sure every single post is perfectly tailored to the network it’s heading to—from getting the image dimensions right to using the best hashtags for that platform. This "set it and forget it" approach is a massive time-saver.
This isn't just about convenience; it's about aligning your strategy with how social media works today. A recent analysis of over 5 million posts proved that quality is crushing quantity. For instance, LinkedIn documents pull in a massive 37% engagement rate, and simple static Instagram images hit 6.2%. Both of these blow the much-hyped Reels format, sitting at 3.5%, out of the water. PostOnce's automation lets you lean into this reality, giving you the freedom to create that amazing content while it handles the tricky distribution part. If you want to dive into the data yourself, you can learn more about the 2025 state of social media engagement.

The interface makes it incredibly straightforward to link your accounts and customize exactly how your content gets shared everywhere, which saves time and keeps your brand looking consistent.
How PostOnce Solves the Real Problem
The biggest challenge that engagement metrics bring to light isn't just figuring out what works. It's finding the time and energy to consistently do what works. So many creators and small businesses have brilliant strategies but just can’t keep up with the execution across every channel. PostOnce was built to fix this by automating the most mind-numbing parts of the job.
By taking the manual labor of multi-platform posting off your plate, PostOnce gives you back your most precious asset: your time. You can put that time back into the things that actually grow your business.
Instead of spending your day copying, pasting, and resizing, you can finally focus on what matters.
- Go Deeper on Data: Spend your time figuring out the why behind your numbers, not just the what.
- Talk to Your Community: Actually jump into the comments and messages to build real relationships.
- Sharpen Your Strategy: Use what you’ve learned to brainstorm even better content for your next campaign.
At the end of the day, PostOnce turns your engagement report from a static document into a living, breathing growth engine. It handles the distribution flawlessly, ensuring your hard-won insights are actually put to work, expanding your reach and making a bigger impact with far less effort. You can discover how PostOnce simplifies content workflows and see it for yourself.
Turning Engagement Data Into Actionable Insights
Looking at your client engagement metrics is a bit like getting a report card for your brand. But just like in school, the grade itself isn’t the point. The real value comes from figuring out why you got that grade and what you can do to improve.
Simply put, data without action is just trivia.
The ultimate goal here is to build a feedback loop where your metrics guide your next move. This shifts you from just watching numbers on a screen to actively refining your client experience in a way that actually moves the needle. Think of your data as a set of clues pointing you toward hidden opportunities.
From Diagnosis to Action
Every metric has a story to tell. A high bounce rate isn't just a number to frown at; it's a loud signal that your landing page isn't giving people what they expected. Likewise, low email open rates are telling you that your subject lines are getting lost in the noise of a crowded inbox.
The trick is to treat every metric as the start of an investigation.
Let’s say you notice a scary-high bounce rate on one of your most important landing pages. Don’t just sigh and add it to a report. Start digging with some pointed questions:
- Is there a disconnect? Does the ad that brought them here promise one thing, while the page delivers something totally different?
- Is the page confusing? Is your call-to-action (CTA) clear and obvious, or is it buried somewhere at the bottom?
- Is it just too slow? People have zero patience. If your page takes forever to load, they're gone.
Answering these questions gives you a clear to-do list: rewrite the headline, make the CTA button bigger and brighter, or compress your images to speed things up. Suddenly, a single, frustrating data point has transformed into a concrete plan for improvement.
Your metrics are not the final score; they are the breadcrumbs your audience leaves behind. Following them reveals the path to a better customer experience and stronger results.
A Practical Framework for Optimization
To make this happen consistently, you need a simple, repeatable process. This prevents good intentions from getting buried under the weight of daily tasks.
- Pinpoint the Problem: Start by choosing one key metric that's lagging behind your goals. Let's say it's a low click-through rate (CTR) on your social media posts.
- Form a Hypothesis: Take an educated guess at why it’s low. A good hypothesis might be, "Our captions are too generic and don't spark enough curiosity to make people click."
- Make a Targeted Change: Now, test that hypothesis with a specific action. You could A/B test two different caption styles—one that's very direct versus one that asks an intriguing question.
- Measure the Impact: Run your test for a set period, then check the results. Did the question-based captions actually improve your CTR? By how much?
- Iterate or Scale: If the change was a success, roll it into your strategy. If it flopped, no big deal—form a new hypothesis and try a different test.
This methodical approach stops you from just throwing things at the wall to see what sticks. It makes sure every change you make is backed by real data.
Of course, engagement goes beyond just clicks. It's crucial to understand how clients truly interact with your content. You can learn more about how to measure content performance to get the full picture. For bringing all this information together in one place, a social media analytics dashboard is an invaluable tool.
Got Questions About Client Engagement Metrics? We’ve Got Answers.
Diving into client engagement metrics can feel like trying to drink from a firehose. There's so much data, and it's not always clear what actually matters. Let's tackle some of the most common questions that come up when people start getting serious about their engagement numbers.
Which Engagement Metric Is The Most Important?
This is the million-dollar question, but the honest answer is: it depends entirely on your goals. There’s no single magic metric that rules them all. The "most important" one is simply the one that best reflects what you're trying to accomplish.
Think about it this way: if you run an e-commerce store, your Conversion Rate is king. You want to see how many people who click your ad actually buy something. But if you’re a YouTuber trying to build a loyal community, you'd be much more interested in Average Watch Time or the number of Comments per Post. Those numbers tell you if people are truly connecting with your content.
Here's a simple framework to find your most important metric:
- Start with your main business goal. Are you chasing leads, building brand awareness, or trying to keep existing customers happy?
- Pick one primary metric that directly measures success for that goal.
- Then, choose a few secondary metrics that give you the full story and add context to that primary number.
How Often Should I Be Tracking These Metrics?
The right tracking schedule isn't one-size-fits-all; it really depends on the platform and how fast things move there.
For something as fast-paced as social media, a weekly check-in is a good rhythm. It’s frequent enough to catch trends as they happen and lets you double-down on what’s working (or quickly pivot away from what’s not). For website metrics like Average Session Duration or Bounce Rate, a monthly review usually makes more sense. This helps you see real patterns and avoid making knee-jerk reactions to a single slow day.
And for the big-picture metrics that measure long-term health, like Net Promoter Score (NPS) or Customer Lifetime Value (CLV), looking at them quarterly or even twice a year is perfectly fine. The goal is to create a consistent routine that gives you enough data to make smart decisions, not to drown in spreadsheets every single day.
What Are Some Common Mistakes People Make When Analyzing Engagement?
It's surprisingly easy to get tripped up when looking at engagement data. A few common pitfalls can completely derail your strategy if you're not careful.
The biggest mistake is chasing vanity metrics. Things like follower counts and page likes feel good, but they don't pay the bills. You should focus on action-oriented metrics instead—the numbers that show people are actually doing something, like click-through rates, shares, and conversions.
Another classic error is looking at a single metric in a vacuum. A fantastic click-through rate doesn't mean much if your landing page has a sky-high bounce rate. You have to connect the dots to see the complete user journey.
One of the most overlooked mistakes is failing to segment your data. Your overall average can hide the real story.
Are new visitors engaging differently than returning ones? Do customers from one city convert better than another? Slicing your data by audience segments is where you'll find the truly powerful insights that let you fine-tune your approach for the people who matter most.
Ready to stop manually posting and start focusing on the engagement data that grows your business? PostOnce automates your entire cross-posting workflow, so you can publish content everywhere effortlessly and spend your time on strategy, not scheduling. Start streamlining your social media today.