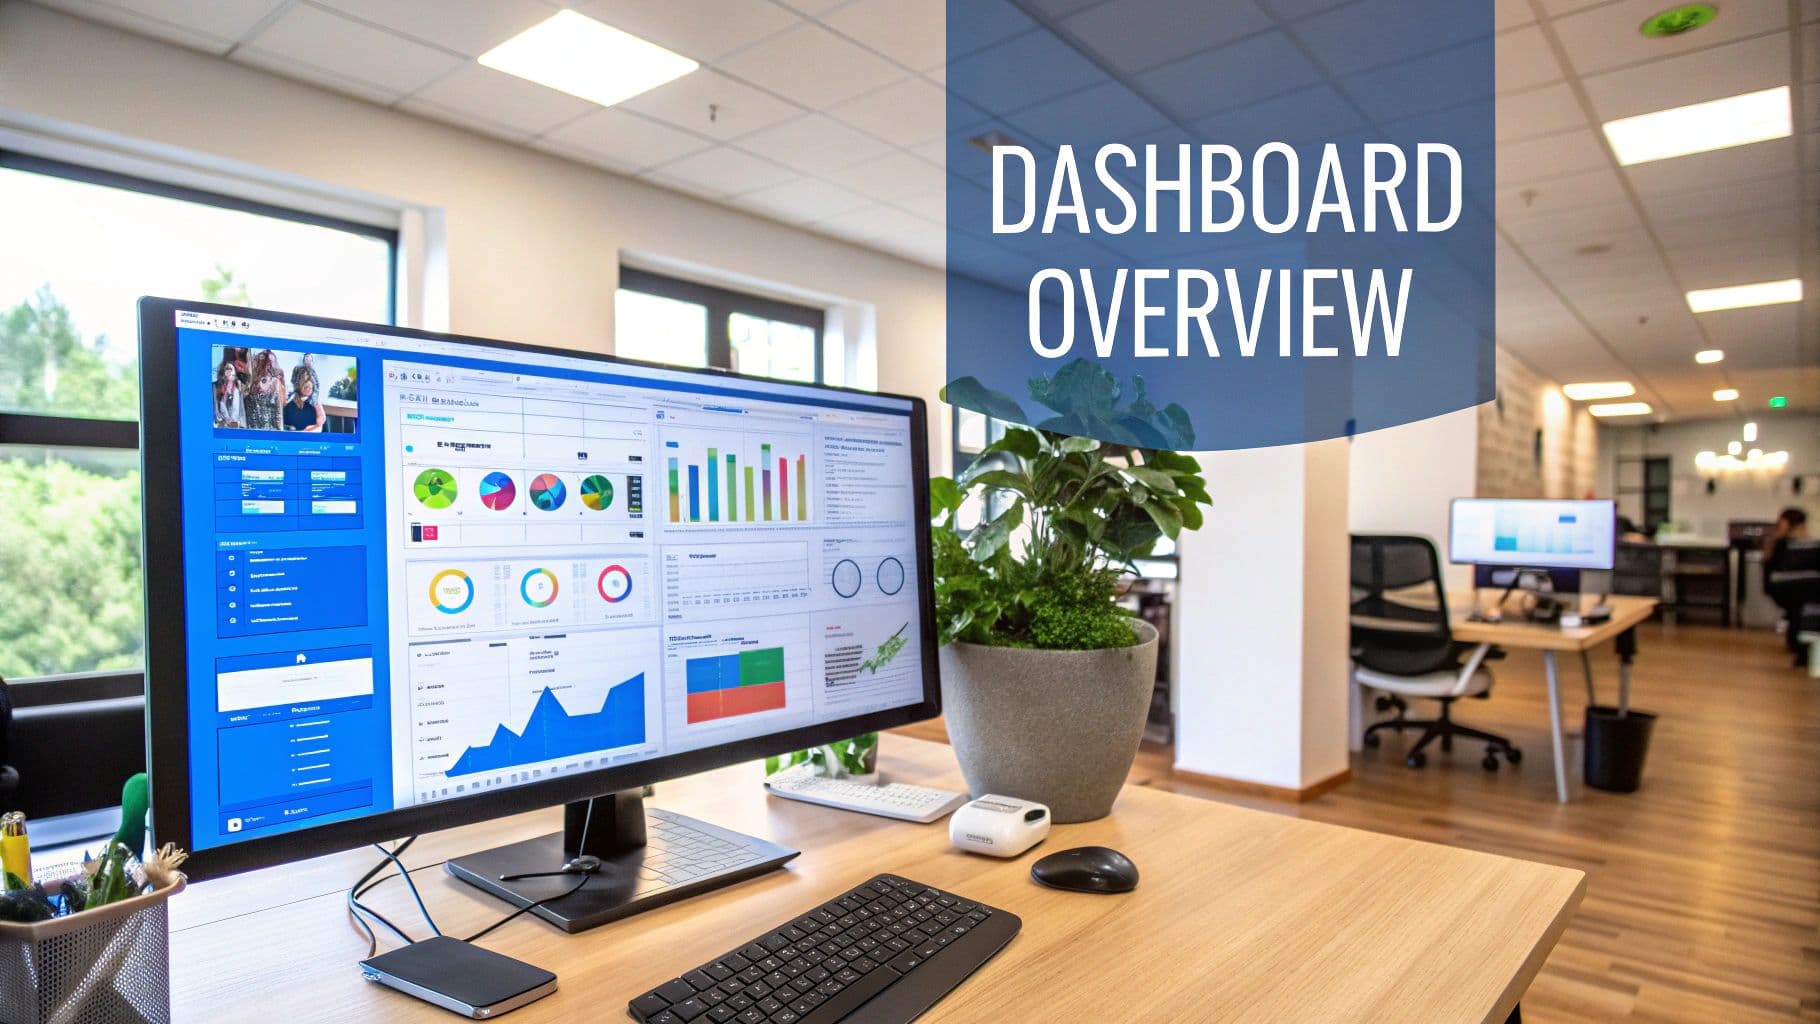
At its core, a social media analytics dashboard is your command center. It pulls together all the jumbled data from your various social networks—Facebook, Instagram, X, LinkedIn, you name it—and organizes it into a single, unified view. Instead of a mess of scattered metrics, you get clear, actionable insights that tell you what's working, what's falling flat, and most importantly, why.
Think of it as the control panel for your entire social media strategy.
From Foggy Spyglass to Digital Command Center
Trying to manage social media without good data is like trying to navigate a ship with a foggy spyglass. You can make out shapes in the distance, but you have no real clarity to steer confidently. You might see a post get a bunch of likes, but do you know if it actually drove traffic to your website? Or if it even reached the people you were trying to talk to? A social media analytics dashboard clears away that fog.
It's a lot like the dashboard in a modern car. It doesn't just give you a speedometer (likes) and a fuel gauge (followers). It provides real-time diagnostics on everything you need to know to get where you're going.
- Campaign Performance: See exactly which campaigns are drumming up the most engagement and conversions across every platform.
- Audience Behavior: Get to know who your audience is, where they hang out online, and what kind of content makes them tick.
- Competitive Landscape: Keep an eye on what your competitors are doing, spot their wins and losses, and find opportunities they’ve missed.
- Return on Investment (ROI): Finally connect the dots between your social media efforts and real business goals, like generating leads and making sales.
Making this shift—from staring at disconnected numbers to looking at a unified command center—is what separates reactive posting from strategic marketing.
Why Dashboards Are More Than Just Pretty Charts
It’s easy to look at a dashboard and see it as just a collection of charts and graphs. But that’s a common mistake. The real magic of a good dashboard is its ability to tell a story with your data. It’s what connects a sudden spike in engagement on an Instagram Reel to a surge in traffic on your product page. It’s what links a dip in sentiment on X (formerly Twitter) to a competitor's new campaign launch.
By transforming raw data into a cohesive narrative, a dashboard gives you the strategic foresight to move beyond reactive posting and build proactive, data-informed campaigns.
This storytelling ability is precisely why these tools are becoming so essential. In 2024, the social media analytics market was valued at an impressive USD 10.23 billion. It’s projected to skyrocket to USD 43.25 billion by 2030, which tells you just how critical these dashboards have become for businesses. You can read more about the social media analytics market projections to understand the full scale of this trend.
Focusing on the Metrics That Truly Matter
A great social media dashboard isn't designed to drown you in numbers. Far from it. Its real job is to cut through the digital noise and spotlight the handful of metrics that actually tie back to what you're trying to achieve as a business. Just tracking likes and follower counts is a bit like only watching the scoreboard at a game—you see the score, but you have no idea how or why it got there.
The trick is to group your metrics into a few key categories. When you do this, you start to see a complete story emerge, moving you from just collecting data to finding real, strategic insights.
H3: Awareness: How Many People Are We Reaching?
This is always the first question you need to answer: "Is anyone out there seeing our stuff?" These metrics form the top of your funnel and give you a sense of your potential audience size.
- Reach: This is the total number of unique people who laid eyes on your post. Think of it as the individual headcount of your audience. High reach is a fantastic sign that your content is breaking free from your immediate followers and finding new eyes.
- Impressions: This number represents the total times your content was displayed in a feed. It doesn't matter if it was the same person seeing it five times; each view counts as an impression. High impressions mean your content is getting a lot of screen time.
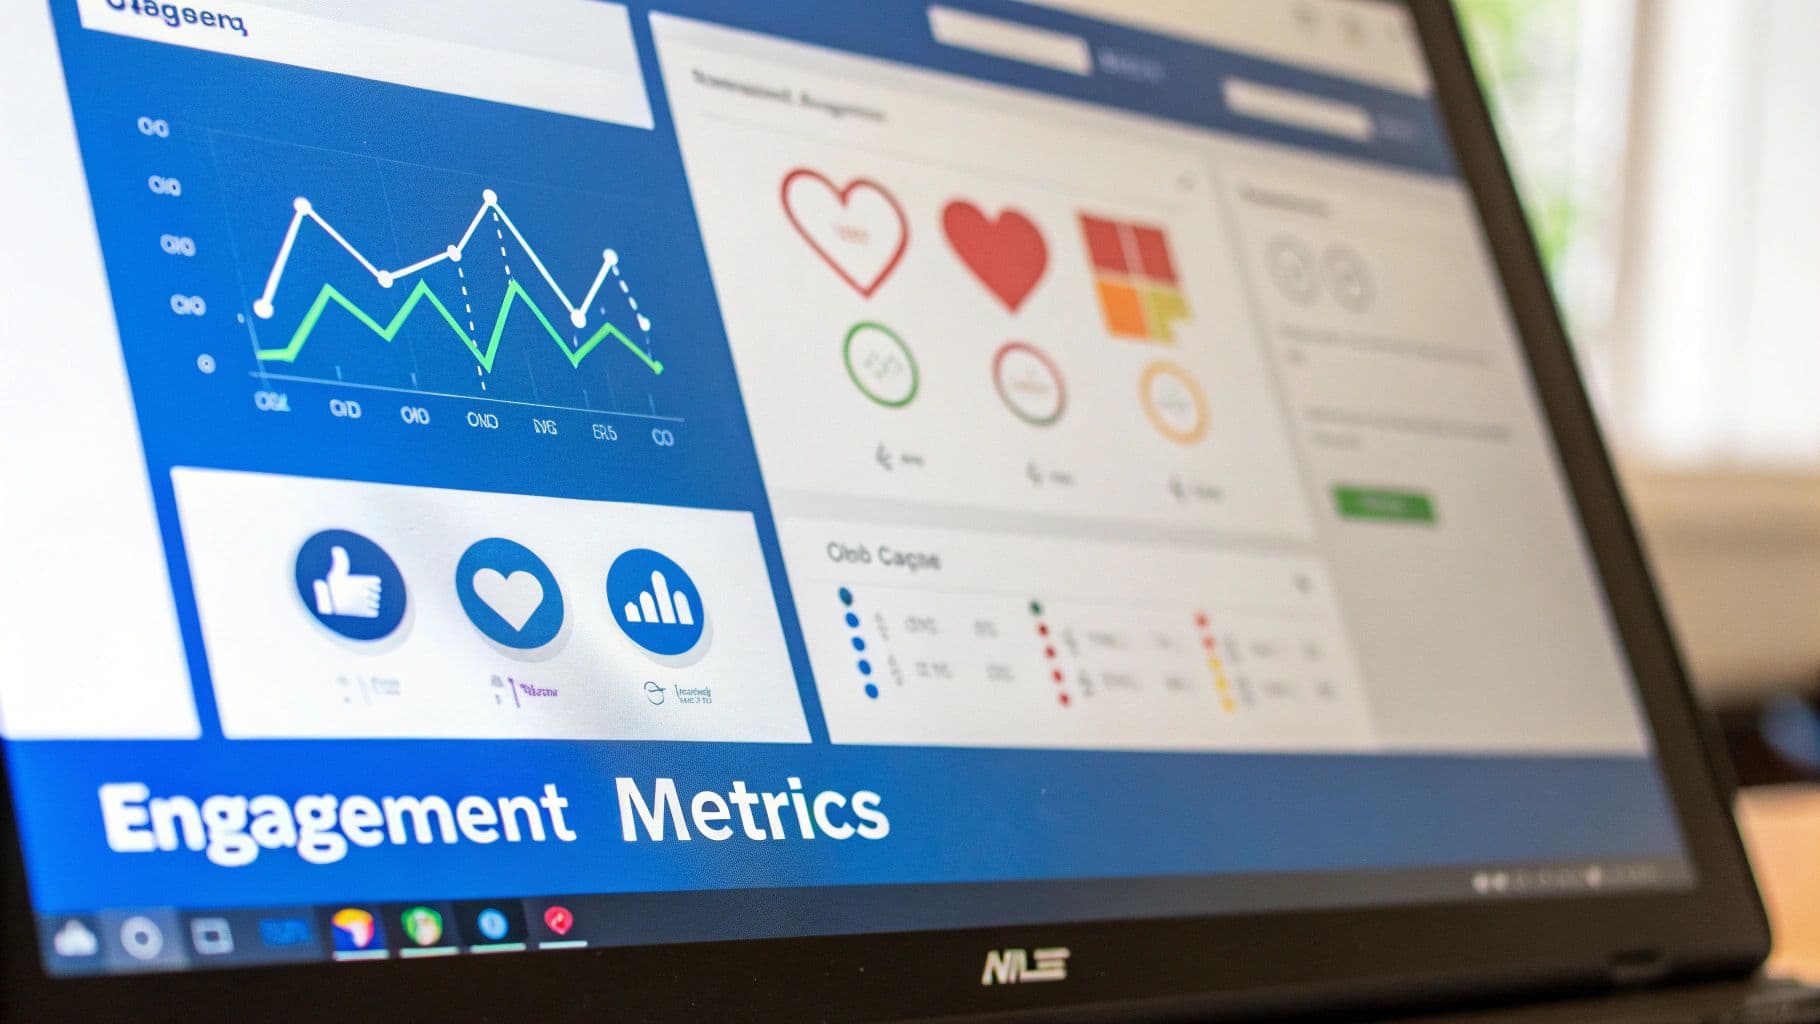
H3: Engagement: Is Our Content Actually Resonating?
Okay, so people are seeing your content. The next logical question is, "Do they even care?" Engagement metrics tell you how your audience is responding, and more importantly, what they genuinely connect with. Remember, a single 'share' is infinitely more valuable than a 'like'. It’s a personal endorsement, a sign that someone is willing to stake their own reputation on your content.
This is where you can see the difference between a large, passive audience and a smaller, highly dedicated one.
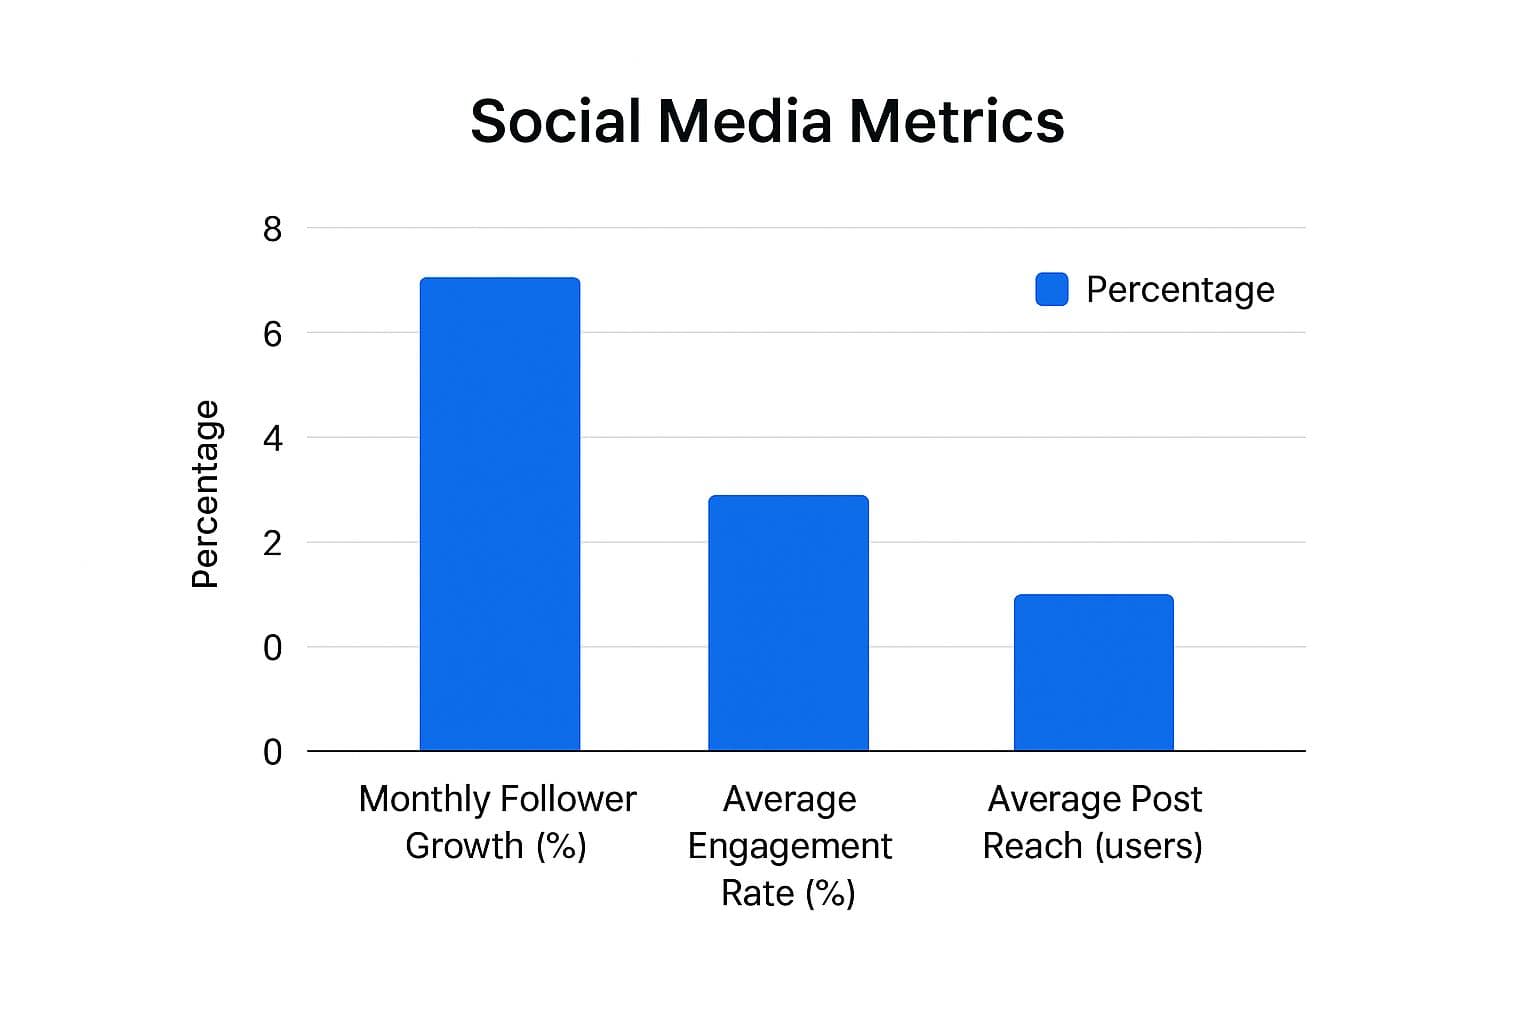
As you can see, a high engagement rate can happen even with lower reach, which points to a loyal community. If you want to dig deeper into the nuances of these numbers, our full guide on https://postonce.to/blog/social-media-metrics is the perfect next step.
H3: Action: Are People Doing What We Want Them To?
At the end of the day, your social media efforts have to support the bottom line. This is where you connect your social activity to real business outcomes and get a crystal-clear picture of who you're actually talking to.
Think of a social media analytics dashboard as the bridge between your posts and your profits. It’s what turns abstract concepts like ‘engagement’ into concrete proof of ROI, like new leads or closed sales.
These are the metrics that really prove the value of your social media strategy.
- Click-Through Rate (CTR): This is the percentage of people who saw your post and were compelled enough to click a link. It’s a direct measure of how persuasive your content and call-to-action are.
- Audience Growth Rate: This tracks how quickly you’re attracting new followers. A healthy, steady growth rate is a sign of an expanding brand presence.
- Audience Demographics: This gives you the "who" behind the numbers—age, location, gender, and interests. This information is gold for creating content that truly hits the mark.
Once you have a handle on these key metrics, you can build them into effective social media analytics reporting strategies that clearly show your impact to your team or your clients.
Essential Metrics for Your Social Media Dashboard
To make this even clearer, it helps to see how these metrics fit together. A well-rounded dashboard doesn't just show you numbers; it helps you ask—and answer—the right strategic questions about your performance.
| Metric Category | Key Metrics | What It Measures | Strategic Question Answered |
|---|---|---|---|
| Awareness | Reach, Impressions, Audience Growth | The size and growth of your potential audience. | "How many people are seeing our brand and is our audience expanding?" |
| Engagement | Likes, Comments, Shares, Saves | How actively your audience interacts with your content. | "Does our content resonate with our audience and inspire them to act?" |
| Action & ROI | Click-Through Rate (CTR), Conversion Rate | The effectiveness of your content in driving specific actions. | "Is our social media activity driving traffic, leads, and sales?" |
| Audience | Demographics, Follower Growth Rate | The composition and loyalty of your follower base. | "Who is our audience, and are we attracting the right people?" |
By organizing your dashboard around these categories, you move beyond simple data points. You start to build a narrative that explains not just what is happening, but why it's happening, giving you the power to make smarter decisions for your brand.
How a Dashboard Transforms Your Strategy
Let's be honest, the real magic of a social media analytics dashboard isn't just about collecting data—it’s about turning those numbers into smart, decisive actions. It’s the bridge between knowing your stats and knowing what to do next. This tool is what moves your strategy from guesswork to a calculated, data-backed approach that actually delivers results.
Instead of fumbling in the dark, you get a clear, consolidated view of everything happening across your social channels. This clarity empowers you to make faster, more confident decisions that are tied directly to your business goals.
Turn Insights into Actionable Intelligence
A great dashboard doesn't just throw charts at you; it tells you the story behind the data. It connects what might seem like random data points into a cohesive picture of your performance, giving you the confidence to act.
-
Truly Understand Your Audience: Pinpoint exactly which content formats, topics, and tones get your followers excited. This means you can stop creating content you think they want and start making content you know they'll love.
-
Prove Your Social Media ROI: For the first time, you can draw a straight line from your social media efforts to tangible business outcomes. By tracking conversions and leads from specific campaigns, you can finally show stakeholders the real financial value of your work.
-
Sharpen Your Competitive Edge: Keep a close eye on your competitors' best-performing content, their engagement rates, and how their audience is growing. This isn't about copying their moves; it's about spotting the gaps in their strategy that you can turn into your advantage.
A Real-World Scenario
Imagine you're running marketing for a mid-sized SaaS company. Your dashboard flags something interesting: a major competitor consistently gets poor engagement and negative sentiment on posts about a specific software feature. You see it right there in the sentiment analysis—users are confused and frustrated. That's not a problem; that's a golden opportunity.
Your team quickly creates a webinar series called "Mastering [Feature Name] The Easy Way" and promotes it heavily on social media. The campaign is a huge success. You've directly addressed a competitor's weakness, solved a customer pain point, and captured a chunk of their market share. This kind of strategic pivot is only possible when your social media analytics dashboard turns raw data into a clear plan of attack.
By translating raw data into a clear strategic narrative, a dashboard gives you the foresight to move beyond reactive posting and build proactive, data-informed campaigns.
This ability to transform strategy is why the market is exploding. The global social media analytics market was valued at USD 13.47 billion in 2024 and is expected to rocket to USD 61.95 billion by 2032. You can read more about these impressive market projections to understand just how big this shift is.
For a broader look at modernizing your entire marketing function, check out this comprehensive guide to data analytics for marketers.
Choosing the Right Analytics Dashboard
https://www.youtube.com/embed/mKu6FI53BxE
Picking a social media analytics dashboard isn't a one-size-fits-all decision. The perfect tool for a solo creator is going to look completely different from what a massive enterprise needs. Your real goal is to find a platform that doesn't just collect numbers but gives you the specific insights that actually match your business goals and, of course, your budget.
Think of it like buying a car. A zippy sports car is fun, but it’s totally impractical if you’re hauling a big family around. On the flip side, a giant SUV is probably overkill for someone just commuting in the city. Your dashboard choice should be just as practical, reflecting everything from your campaign complexity to your team size.
Focus on Core Functionality
It’s easy to get distracted by shiny, advanced features, but first, make sure any tool you’re considering has the fundamentals locked down. A strong foundation means the dashboard can grow with you and deliver real value day in and day out. The right platform should feel less like a chore and more like a natural extension of your brain.
Here are the non-negotiables to look for:
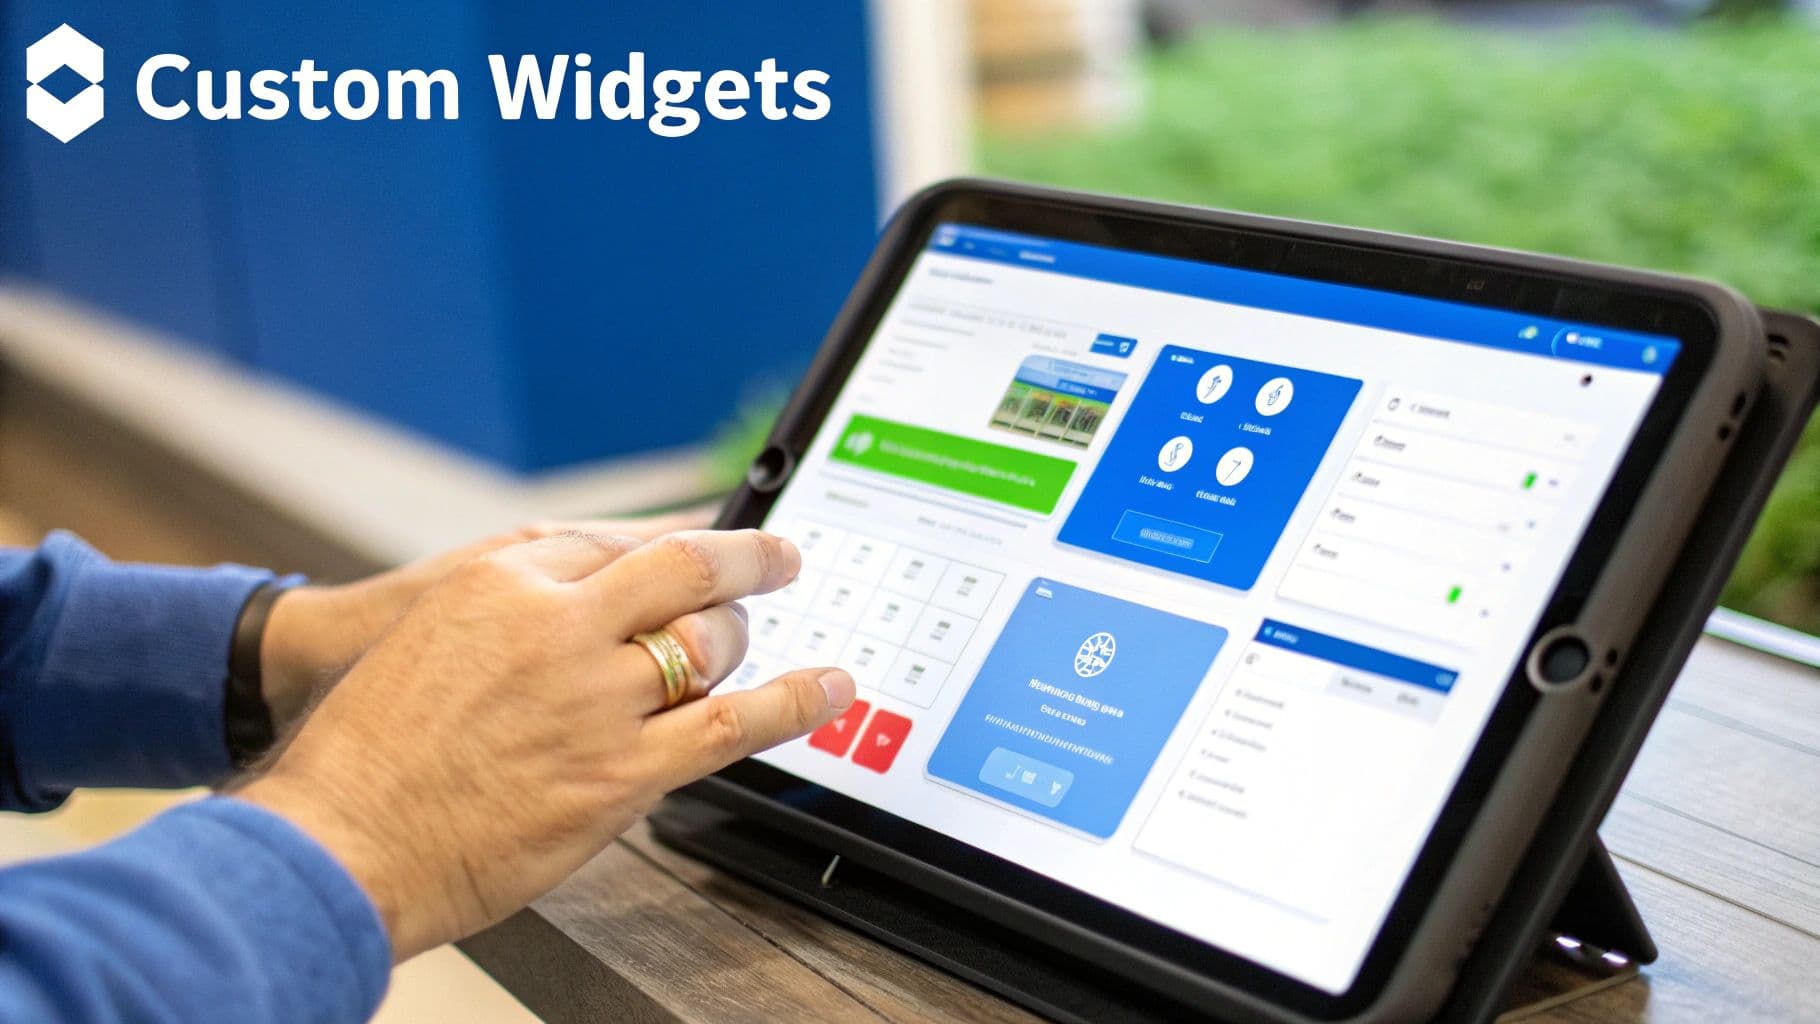
- Customizable Reporting: Can you build a report that shows only the KPIs that matter to you? A great dashboard cuts through the noise so you can show stakeholders a clear, concise story of your performance and return on investment.
- Real-Time Data Tracking: Social media moves at the speed of light. You need the ability to watch campaign performance and audience sentiment as it happens. This lets you make quick, smart decisions—like pouring more fuel on what’s working or pulling the plug on what isn't.
- Competitive Benchmarking: It's the classic question: how are you doing compared to everyone else? A truly useful dashboard gives you clear benchmarks, showing you exactly where you're winning (and where you're falling behind) in follower growth, engagement, and content strategy.
- Sentiment Analysis: This is where you go beyond the numbers to understand the feeling behind the metrics. Knowing if people are talking about your brand in a positive, negative, or neutral way is absolutely crucial for managing your reputation.
Integration and Scalability
Your social media analytics tool shouldn't live on an island. It becomes exponentially more powerful when it connects seamlessly with the other software you rely on, like your CRM or email marketing platform. This connection creates a single, unified view of your data, where social media insights can shape your entire marketing approach.
The right dashboard acts as a central hub, connecting disparate data points to create a single, cohesive view of your customer's journey and your marketing's impact.
Smooth integration also makes managing multiple platforms much easier. For example, knowing what content resonates most with your audience helps you refine your distribution strategy. To streamline that, you might think about how a tool supports your workflow for social media cross-posting, which is essential for a consistent brand voice. It's also smart to look into platform-specific options, like the best Instagram analytics tools, to see how they handle unique challenges.
When you're talking to vendors, don't be afraid to ask the tough questions. How will your tool help me prove ROI to my boss? What kind of support can I expect when I run into a problem? Getting clear answers will help you find a dashboard that’s not just a piece of software, but a true strategic partner.
The Future of Social Analytics with AI
The next wave of social media analytics is already breaking, and it's powered by artificial intelligence. Think of it this way: a standard dashboard is like a rearview mirror—it’s great for seeing where you've been. An AI-powered dashboard, on the other hand, is like a GPS navigator, showing you the smartest route forward. This fundamental shift turns your social strategy from reactive to truly proactive.
AI and machine learning are completely changing what we can expect from a modern social media analytics dashboard. These systems can comb through immense volumes of data at a speed no human ever could, uncovering subtle patterns and golden opportunities that would otherwise go unnoticed. This isn't some far-off concept; it’s a practical upgrade available to any serious marketer right now.
The need for these smarter tools is only growing. Projections show that by 2025, more than 5.24 billion people will be active on social media, creating an almost unimaginable flood of data. This massive growth is precisely why AI-driven solutions are becoming essential; you can read more about how rising user numbers impact the analytics market and drive this trend.
Shifting From Reporting to Predicting
The biggest leap forward AI delivers is moving from simple historical reporting to genuinely predictive analytics. Instead of just looking back at which post did well last week, AI models can actually forecast which topics are about to trend before they hit their peak.
Imagine your dashboard flagging a small, niche topic that's just starting to bubble up within your target audience. That's your cue. It gives you a crucial head start to create relevant content and own the conversation before your competitors even realize what's happening.
AI-powered analytics don't just tell you what happened. They give you an educated guess about what will likely happen next, allowing you to place your bets and allocate your budget with much more confidence.
This predictive muscle also applies to your campaigns. It can help you estimate the potential reach or engagement for a new video or blog post by analyzing past performance against what's currently trending.
Automation and Deeper Audience Insights
Beyond looking into the future, AI also takes a lot of tedious work off your plate. It can automatically generate performance reports, write up key findings, and even pinpoint the absolute best times to post for maximum reach and engagement.
But its real superpower might be in how it helps you understand your audience. AI can identify distinct groups of users who share subtle behaviors and interests—segments you would likely never spot on your own.
- Predictive Analytics: Get ahead of the curve by forecasting future trends and estimating how your content will perform before you even post it.
- Automated Reporting: Free up your team's time from building reports. Let the AI handle the data-pulling and generate insightful summaries automatically.
- Advanced Segmentation: Discover hidden pockets of your audience based on complex behavioral data, opening the door for hyper-targeted and more effective campaigns.
When you bring these intelligent features into your workflow, your dashboard stops being a simple measurement tool. It becomes a strategic partner, actively guiding you toward smarter, faster, and more impactful decisions.
Common Questions About Analytics Dashboards
Diving into the world of analytics always brings up a few practical questions. It’s one thing to have a powerful social media analytics dashboard, but it’s another thing entirely to know how to weave it into your daily work. Let’s walk through some of the most common things people ask so you can use these tools like a pro.
Getting these answers straight helps you go from just having a tool to actually using it as a strategic partner. Whether it's a quick daily check-in or a deep quarterly review, finding the right rhythm and knowing what your dashboard can do is how you get real value from it.
How Often Should I Review My Dashboard?
Honestly, there’s no single right answer here—it all comes down to your goals. Think of it like the gauges in a car. You glance at the speedometer constantly, but you probably only check the tire pressure every so often. The trick is to find a routine that matches what you’re trying to achieve without getting buried in data.
For the day-to-day stuff, a quick check-in is a must. This is your morning coffee check-in to monitor brand sentiment, spot any customer service fires that need putting out, and jump into conversations as they happen. It’s your finger on the pulse of your community.
But when you have a live campaign, you’ll need to ramp things up.
- Active Campaigns: Plan to review performance 2-3 times per week. This gives you enough time to make smart adjustments on the fly, like shifting budget to a better-performing ad or tweaking a message that isn't quite hitting the mark.
- Strategic Reviews: For the big-picture planning, a deep dive on a monthly or quarterly basis is perfect. This is where you’ll spot long-term trends in audience growth, content performance, and overall ROI to guide your strategy for the coming months.
Can a Dashboard Really Track Competitors?
Yes, absolutely—and for many, this is a total game-changer. Good dashboards come equipped with powerful competitive analysis features that turn your tool into a source of genuine market intelligence. It's like having a periscope to see what’s working for others in your space, which helps you benchmark your own performance in a meaningful way.
You can track a surprising amount of public data from your rivals, uncovering little nuggets of gold that can shape your own content and campaign ideas.
By analyzing competitor data, you’re not just keeping score. You’re identifying strategic opportunities, learning from their successes and failures, and understanding what resonates with the audience you both share.
Most platforms let you track key metrics like their follower growth, how often they post, their engagement rates, and even which of their posts are getting the most attention. Some of the more advanced tools can even run sentiment analysis on their brand mentions, giving you a clear window into how their audience feels about them. For more ideas on what to do with these insights, check out our guide with key social media management tips.
Are Free Analytics Tools Good Enough?
The built-in analytics from the social platforms themselves (like Meta Business Suite or X Analytics) are a fantastic place to start. They give you the essential data on your own accounts—things like reach, impressions, and basic engagement stats. If you're just getting started, they're incredibly helpful for getting a feel for your audience and what content they like.
But you’ll start to feel their limits as your strategy gets more serious. The biggest headache is that they all live in separate houses. You have to log in and out of each platform, making it a real pain to get a single, clear view of a campaign that’s running across multiple channels.
These free tools also don’t have the more sophisticated features that come standard in a dedicated social media analytics dashboard. You won’t find in-depth competitor tracking, advanced sentiment analysis, or super-flexible reporting. So while they’re great for beginners, you’ll eventually need a paid dashboard to see the whole picture, dig deeper into the data, and truly measure the ROI of all your social media work.
Ready to transform your data into a clear strategy? PostOnce simplifies your entire social media workflow by automating distribution across all your networks. Stop juggling platforms and start focusing on what matters—creating great content. Explore PostOnce and amplify your reach today!