Let’s be honest—most social media data just feels like noise. It's incredibly easy to get lost in a sea of numbers that look impressive on paper but don't actually tell you if your strategy is hitting the mark. The secret is to shift your focus away from vanity metrics and onto the numbers that truly signal business health and drive real growth.
Why Most Social Media Metrics Are Misleading

Picture your social media presence as a ship sailing toward a specific destination, whether that's more sales or stronger brand loyalty. A lot of marketers get fixated on the size of their ship—their follower count—thinking that bigger automatically means better. But a massive ship with no compass or rudder is just drifting aimlessly.
This is the fundamental problem with chasing misleading social media metrics. Follower counts, page likes, and even raw impressions are often just vanity numbers. They look great in a report but fail to answer the single most important question: is our social media activity actually impacting the bottom line?
The Compass and Rudder of Your Strategy
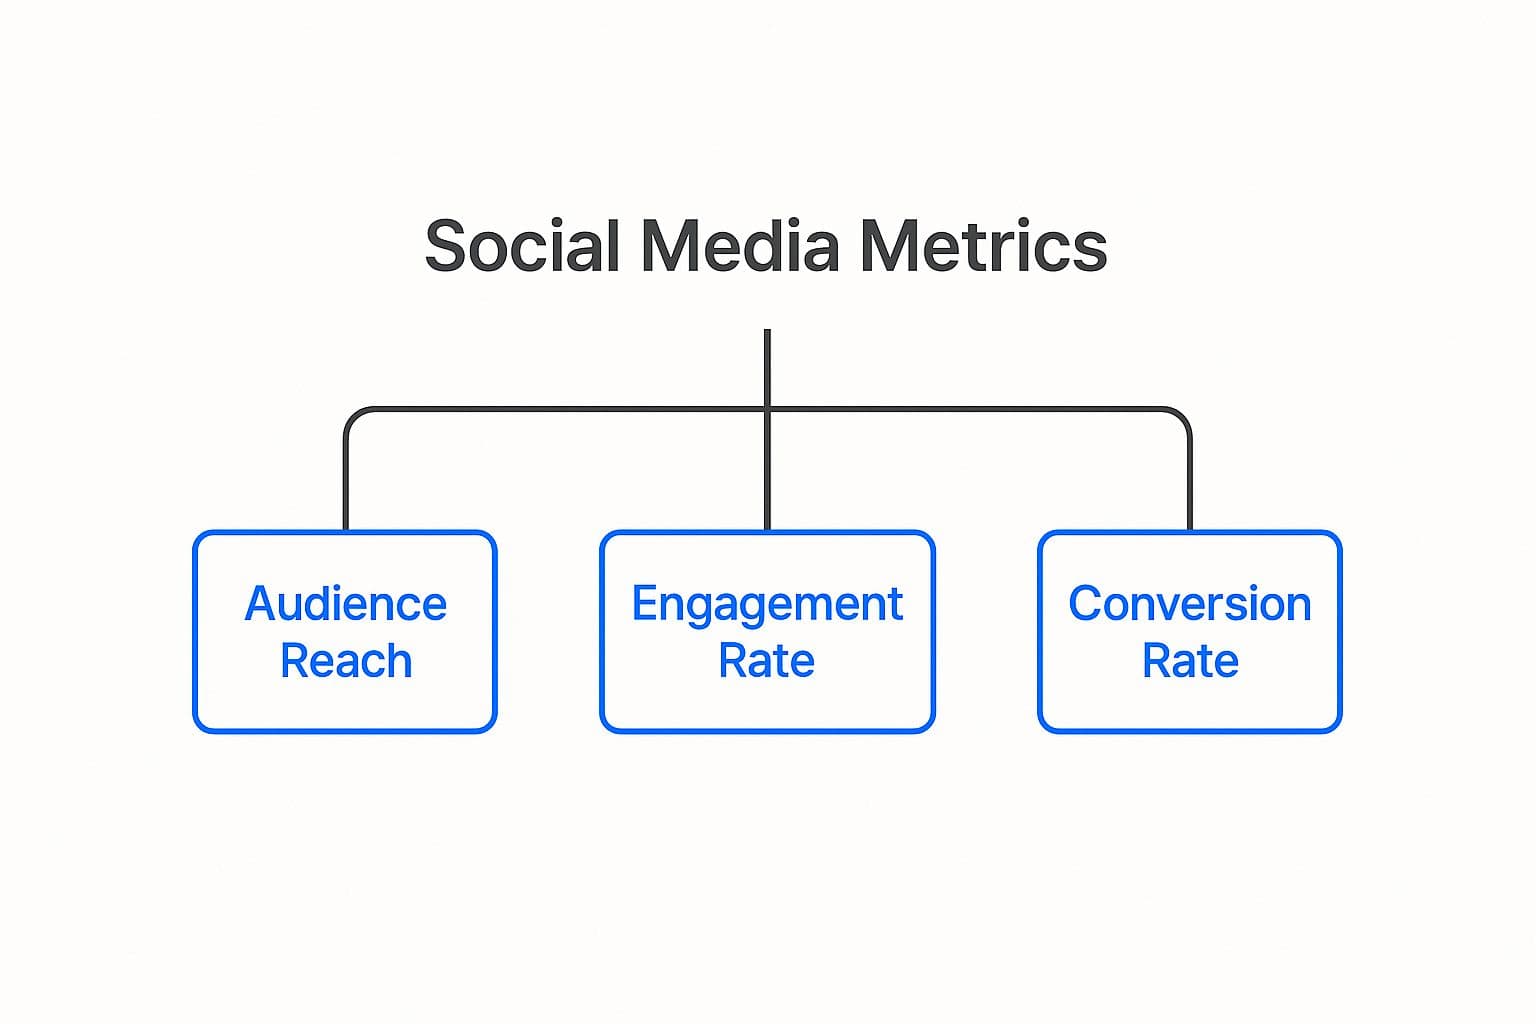
The real power is in the metrics that act as your compass and rudder, guiding your decisions and steering you toward your goals. These are your engagement and conversion metrics.
- Engagement Metrics (Your Compass): Things like comments, shares, and saves show you which way your audience is facing. They tell you what content is hitting home, building a community, and making your brand stronger.
- Conversion Metrics (Your Rudder): Numbers like click-through rate (CTR), leads generated, and sales track the actions that directly steer your business forward. This is where you connect social media activity to tangible results.
Shifting your focus from surface-level numbers to actionable insights transforms your strategy from a guessing game into a predictable growth engine. It’s about measuring what matters, not just what’s easy to count.
With 5.24 billion active social media users across the globe, the potential to reach customers is staggering, but so is the noise. This huge user base—over 60% of the world's population—really highlights why you need a precise strategy to cut through the clutter.
By learning which numbers truly point to business health, you can stop wasting energy on metrics that don't move the needle. For a more detailed look into why common approaches can be flawed, check out this excellent social media analytics guide. Getting a solid handle on these concepts is also a cornerstone of effective social media reputation management.
2. Moving Beyond Likes to Meaningful Engagement
When you're looking at your social media performance, engagement is the real pulse of your community. It's so easy to get a little thrill from a post that racks up hundreds of likes, but that's just scratching the surface. To build a strategy that actually drives results, you have to understand that not all interactions are created equal.
Think of a like as a friendly, low-effort nod. Someone saw your post, appreciated it, and moved on. It’s nice to get, but it's a pretty passive action.
A comment, on the other hand, is a much bigger deal. That person took the time to stop, think, and share their thoughts with you. This is where the magic happens—it’s the start of a conversation and the foundation for building a real community.
Then we have shares and saves. These are the true power players. When someone shares your content, they’re essentially endorsing it to their own network. They’re saying, "This is so good, I’m willing to put my name on it." A save is just as valuable; it tells you your content was so useful or inspiring that someone wants to keep it for later.
Calculating Your True Engagement Rate
So, how do you measure this deeper connection? You need to look at your engagement rate. This is the one metric that tells you how much your audience is actually interacting with your content, not just how many people might have seen it. A high rate means your message is hitting home.
There are a few ways to slice this, but a solid, all-purpose formula is:
- (Total Engagements [Likes + Comments + Shares + Saves] / Total Followers) x 100 = Engagement Rate %
This simple percentage puts everything into perspective. Think about it: an account with 1,000 followers that gets 100 engagements has an incredible 10% engagement rate. That's far more impressive than an account with 100,000 followers getting 500 engagements, which works out to a meager 0.5% rate. Size isn't everything; connection is.
Understanding Different Types of Engagement Metrics
To truly grasp what your audience is telling you, it helps to break down what each type of engagement really signifies. Some actions are quick acknowledgments, while others represent a much deeper level of commitment.
This table clarifies the different layers of interaction:
| Metric | What It Measures | Why It Matters |
|---|---|---|
| Likes/Reactions | Passive approval of your content. | Shows initial resonance and appeal at a glance. It's a low-barrier way for your audience to say "I see you." |
| Comments | Active participation and conversation. | Indicates your content was thought-provoking enough to elicit a response. This is where you build relationships. |
| Shares/Retweets | Audience endorsement and amplification. | The ultimate compliment. Your content was so valuable someone wanted to show it to their own audience. |
| Saves | Content utility and future reference. | A strong signal that you're providing evergreen value. People save things they want to come back to. |
| Clicks | Intent to learn more or take the next step. | Measures how well your content drives action, whether it's reading a blog post or visiting your website. |
As you can see, a "save" often carries more weight than a "like" because it signals long-term value, while a "share" shows that your content is resonating enough to be amplified.
Decoding What Your Audience Wants
When you start analyzing which types of engagement your posts are getting, you're essentially learning your audience's language. Seeing a spike in saves on your "how-to" videos? That's a clear sign they want more practical, educational content. Are your funny, behind-the-scenes posts getting all the comments and shares? Lean into that relatable, human side of your brand.
This infographic does a great job of showing how all these metrics fit together to tell a complete story.
As the graphic illustrates, engagement isn't just a feel-good metric; it’s the critical link between getting your content seen and actually guiding people toward becoming customers.
Ultimately, these social media metrics aren't just for show—they directly impact your bottom line. As outlined in a fascinating study on digital trace data, companies that effectively analyze interactions like likes, comments, and shares can fine-tune their marketing and boost their revenue.
With a tool like PostOnce, tracking all these different engagement metrics across your social channels is completely automated. The platform pulls all the data into clean, easy-to-read reports. This means you can stop spending hours in spreadsheets and start focusing on what really matters: creating more of the content that sparks those valuable conversations and shares.
Measuring Your Content's True Reach
Okay, so you've got a handle on engagement. That’s a huge step. But likes and comments only tell part of the story. The next big question you have to ask is: are you actually reaching new people, or just talking to the same loyal fans over and over? This is about measuring your brand’s actual footprint, not just the activity within your existing circle.
To do this well, you absolutely must get the difference between reach and impressions. It's a classic point of confusion, but a simple analogy makes it crystal clear. Think of it like a billboard on a busy highway.
- Impressions are the total number of eyeballs that saw your billboard. If one commuter drives past it every single day for a week, that one person generates seven impressions.
- Reach, on the other hand, is the number of unique people who saw it. That same commuter, despite their seven glances, counts as just one person reached.
See the difference? Both of these metrics are crucial. High impressions mean the platform's algorithm likes your content and is serving it up frequently. But high reach is the real prize—it proves you’re breaking out of your bubble and getting in front of fresh audiences.
Gauging Your Growth and Competitive Edge
Beyond a single post's visibility, you need a way to track your momentum over the long haul. Are you just treading water, or is your audience actually expanding? This is where a couple of other key metrics come into play.
- Follower Growth Rate: This isn't just about the raw number of new followers. It's about the speed at which you're gaining them. A healthy, steady growth rate is a powerful sign that your overall content strategy is hitting the mark and convincing casual scrollers to stick around.
- Social Share of Voice (SOV): This one is about context. It measures how much of the conversation in your specific industry is about you versus your competitors. For example, if 1,000 people are talking about running shoes this week and 250 of those mentions are about your brand, you hold a 25% SOV. It’s a direct reflection of your influence in the market.
These metrics give you the bigger picture. It’s not just about how many people see your posts, but how effectively you’re growing your territory and commanding attention in your niche. And remember, different platforms offer unique insights, like how LinkedIn handles profile view metrics, which can be a goldmine for B2B visibility.
This is exactly where the PostOnce dashboard becomes your command center. It pulls all these awareness metrics together so you don't have to.
With a single glance, you can see your unique reach, total impressions, and follower growth across every account you’ve connected. By having all this data collected and visualized for you, spotting trends becomes second nature. You can immediately see if your Instagram reach is outpacing your Facebook reach and tweak your strategy on the fly, all without getting lost in a dozen different analytics tabs.
Connecting Social Media to Real Business Results
Let’s be honest. Likes and shares are great for the ego, but they don't directly pay the bills. The real test for any social media effort is whether it drives tangible business results. This is where we bridge the gap between a casual scroll and a completed sale, turning what can feel like a cost center into a genuine revenue engine.
The trick is to look past the social-only numbers and zero in on the metrics that actually move the needle for your business. These are the stats that answer the big question everyone in leadership wants to know: “Is our social media marketing actually working?” When you can answer that with cold, hard data, justifying your strategy and budget becomes a whole lot easier.
The three metrics that truly tell this story are Conversion Rate, Click-Through Rate (CTR), and Return on Ad Spend (ROAS).
Following the Breadcrumbs to a Purchase
To measure what really matters, you have to follow a user's journey from the moment they see your post to the second they hit "buy now." This isn't about guesswork; it's a science made possible by a couple of indispensable tools: UTM parameters and tracking pixels.
- UTM Parameters: Think of these as little tracking tags you add to your links. They act like a digital passport, telling your analytics tools (like Google Analytics) precisely where a visitor came from—which social network, which campaign, and even which specific post sent them your way.
- Tracking Pixels: This is just a tiny piece of code you add to your website. It acts as a lookout, spotting when someone who clicked your ad on Facebook adds a product to their cart or finalizes a purchase.
Putting these tools to work gives you a clear line of sight, allowing you to directly attribute sales and leads back to specific social media activities. This is the bedrock of a data-driven social media strategy plan that’s built for real growth.
Mastering Your Bottom-Line Metrics
Once your tracking is set up, you can finally measure the numbers that prove your financial impact.
Click-Through Rate (CTR) is your first real test. It tells you what percentage of people who saw your post actually cared enough to click the link. A low CTR is a sign that your creative, your copy, or your offer isn't hitting the mark. A high CTR means you’ve successfully piqued their interest.
Conversion Rate is the crucial next step. Of all the people who clicked, what percentage actually did the thing you wanted them to do, like make a purchase or sign up for a newsletter? This is the ultimate proof that your content isn't just interesting—it's persuasive.
Return on Ad Spend (ROAS) is the most direct measure of profitability for your paid campaigns. It answers a simple question: For every dollar we spent on ads, how many dollars did we make back? A ROAS of 4:1 means you earned $4 for every $1 you invested.
Keep in mind that the global social media landscape is incredibly diverse. Your strategy has to adapt. For instance, 50.8% of users worldwide say their main reason for using social media is "keeping in touch with friends and family." Knowing little details like this helps you craft campaigns that feel more natural and, in turn, convert better.
To get the full picture of how social media contributes to your goals, it’s worth understanding cross-channel attribution. This helps you see how different marketing touchpoints work together to guide a customer along their entire journey.
With PostOnce, you can take a lot of this complexity off your plate. By automating your content scheduling, it frees you up to spend less time posting and more time analyzing these critical business metrics—ensuring your strategy is always fine-tuned for the best possible return.
Building Social Media Reports That Tell a Story

Let's be honest: raw data is boring. A spreadsheet packed with numbers might be technically correct, but it’s not going to inspire your team or convince leadership to invest more in your work. To truly show the value of your social media efforts, you have to turn those numbers into a compelling story.
A great report doesn't just present data—it interprets it. It shines a light on the wins, takes an honest look at what fell flat, and lays out a clear plan for what comes next. Think of yourself as a detective laying out the evidence. The metrics are your clues, and your job is to explain what they all mean and why they matter to the business's bottom line.
This means you have to go beyond just listing your engagement rate or follower count. You need to connect the dots and explain the "why" behind the "what."
From Data Points to Plot Points
To build a narrative, you need to be intentional about how you structure your report. Don’t just throw every metric you can find onto a slide. Instead, hand-pick the data that supports the story you’re telling, whether it's a story of steady growth, a wildly successful campaign, or an important lesson learned from a content experiment.
A strong report should answer a few key questions for anyone reading it:
- What did we set out to achieve? Remind everyone of the original goals.
- What actually happened? Present the most important key performance indicators (KPIs).
- Why did we see these results? This is where you connect the data to specific posts, campaigns, or platform changes.
- So, what do we do next? Offer clear, actionable recommendations.
This simple framework transforms a dry data summary into a strategic guide for the future. It’s the difference between a report that gets filed away and forgotten, and one that gets passed around and discussed in strategy meetings. Crafting a consistent narrative across all your channels is a huge part of this, a topic we dive into in our guide on social media cross-posting.
The goal is to create actionable documents that drive smart decisions. A report that doesn't lead to a clear "next step" is a missed opportunity to turn insights into impact.
Essential Components of a Monthly Social Media Report
To make sure your report is both comprehensive and easy to follow, it helps to include a few standard sections every time. Consistency helps your stakeholders know exactly what to expect and where to find the information they care about most, which makes your story that much easier to tell.
Here’s a look at the key elements that make up a robust and insightful monthly report.
Essential Components of a Monthly Social Media Report
| Report Section | Key Metrics to Include | Purpose of This Section |
|---|---|---|
| Executive Summary | Top 3-5 major wins, key takeaways, and a brief overview of performance against goals. | Provides a high-level snapshot for busy stakeholders who need the main points quickly. |
| Performance vs. Goals | Metrics directly tied to your monthly objectives (e.g., Conversion Rate, Follower Growth Rate). | Clearly demonstrates progress and holds your strategy accountable to predefined targets. |
| Audience & Engagement | Reach, Engagement Rate (by post/type), Follower Growth, Top Performing Posts. | Shows how your community is growing and interacting with your content, highlighting what resonates. |
| Business Impact | Website Clicks, Conversion Rate, Leads Generated, Return on Ad Spend (ROAS). | Connects social media activity directly to tangible business outcomes and demonstrates ROI. |
| Learnings & Next Steps | Analysis of what worked (or didn't) and a list of 2-3 specific actions for the upcoming month. | Turns data into a forward-looking plan, ensuring continuous improvement and strategic agility. |
Building a report like this month after month can be a real grind. Fortunately, with PostOnce, generating these reports is much simpler. The platform automatically pulls all your cross-channel social media metrics into one dashboard, creating clean, visual summaries. This frees you from the tedious task of data collection, letting you focus on the most important part: telling a powerful story that drives your brand forward.
Common Questions About Social Media Metrics
As you start digging into your analytics, it's completely normal for questions to bubble up. The sheer volume of social media metrics can feel like you're trying to drink from a firehose, but a few core ideas can clear things up. Let’s walk through some of the most common questions I hear, so you can start looking at your data with real confidence.
Getting these fundamentals down will help you build a smarter, more efficient workflow. Instead of getting stuck in the weeds, you'll be able to make quick, data-informed decisions that actually move the needle.
How Often Should I Track My Social Media Metrics?
There's no single right answer here—the best tracking frequency really depends on your goals. I like to compare it to tending a garden. Some plants need daily attention, while others are fine with a weekly check-in. Your metrics follow the same principle.
-
Daily Check-ins: For fast-moving campaigns or keeping an eye on community health, a quick daily glance is a must. You'll want to look at things like comments, shares, and replies. This lets you jump into conversations in real-time and quickly see if a piece of content is soaring or sinking.
-
Weekly Analysis: To spot broader trends, a weekly deep dive is perfect. This is your time to analyze your engagement rate, reach, and follower growth. This rhythm helps you understand what’s resonating over a longer period without getting lost in the noise of daily ups and downs.
-
Monthly & Quarterly Reports: For the big picture, you should pull together comprehensive reports every month or quarter. This is the ideal time to evaluate bottom-line metrics like conversion rate and Return on Ad Spend (ROAS), which usually align with your company's overall business cycles.
Do I Need Different Metrics for Different Platforms?
Yes, absolutely. While some metrics like engagement rate are universally important, each social media platform has its own unique culture and user behavior. To get a truly accurate picture of your performance, you have to tailor your key performance indicators (KPIs) to the specific strengths of each channel.
Think about it: on a highly visual platform like Instagram, metrics such as Reel shares and post saves are huge signals of content value. But over on a professional network like LinkedIn, the focus shifts completely. There, you’re looking at article shares, profile clicks, and leads generated from your content. And for a platform like TikTok, watch time and video completion rate are the ultimate signs of whether your content is truly grabbing people's attention.
Focusing on platform-specific metrics is how you understand what your audience on that channel actually values. A one-size-fits-all report can easily hide powerful insights and send you down the wrong strategic path.
What Are Vanity Metrics and Should I Ignore Them?
Vanity metrics are those numbers that look great on the surface but don't necessarily connect to real business results. The classic examples are total follower count and raw page likes. It feels good to see them go up, but they don't tell you if your audience is truly engaged or if your work is actually paying off.
So, should you just ignore them? Not entirely. A steadily growing follower count is often a healthy sign of brand awareness. The key is to never make them your main measure of success. Instead, give priority to actionable metrics—the numbers that give you real insight, like conversion rates and click-through rates. These are the metrics that show how your audience is interacting with your content and whether your social media strategy is delivering a true return on investment.
Ready to stop guessing and start making data-driven decisions? With PostOnce, you can automate your content distribution and get clean, consolidated reports on the social media metrics that matter most. Free up your time to focus on strategy, not spreadsheets. Learn more about PostOnce and start your free trial today!