Social media report analysis is all about taking raw data from your channels and turning it into a clear story about what’s working, what isn’t, and why. It’s the crucial step where you look past the surface-level numbers to find real, actionable insights that tie your social media efforts directly to business goals.
Beyond Likes: What Social Media Analysis Really Means
Let's reframe how we think about reporting. It's not a tedious chore; it's more like a regular health check-up for your brand, transforming a jumble of data into a clear narrative. This process is the bridge connecting your daily posts to tangible results like generating leads, boosting sales, and building a loyal community. It’s the difference between guessing what to do next and making confident, data-backed decisions.
The sheer scale of social media today makes this analysis more critical than ever. We're talking about approximately 5.24 billion active users across the globe, which is nearly 64% of the world's population. While connecting with friends and family is the main driver for over half of these users, many also use these platforms to discover brands and catch up on news. This creates a massive opportunity for businesses to engage. You can dive deeper into these user behaviors in the global state of digital report.
From Data Points to Strategic Direction
Good analysis isn’t just about collecting metrics—it’s about interpreting them. A single report can feel like a flood of numbers, but the real goal is to spot the patterns that tell you a story about your audience and your strategy.
The real value of social media report analysis lies in its ability to answer the "so what?" behind your data. It transforms a simple metric like 'reach' into a strategic insight about campaign effectiveness.
To get the full picture, it's also important to be clear on related concepts, like understanding the distinction between social listening and social monitoring. While monitoring is about tracking mentions of your brand, listening is about interpreting the broader sentiment and conversations happening across your entire industry.
Visualizing Your Performance
Let's be honest, nobody wants to get lost in a sea of spreadsheets. This is where the right tools become indispensable. Platforms like PostOnce are designed to pull all your metrics from every channel into one clean, intuitive dashboard.
Having this unified view lets you quickly compare performance across different networks, so you can see which platforms are actually driving valuable engagement. Instead of spending hours manually compiling reports, you can focus your time on what truly matters: understanding the story your data is telling and planning your next winning move.
What Social Media Numbers Actually Mean
A social media report can feel like you're drowning in data. But smart analysis isn't about tracking every single number; it's about knowing which ones tell the real story of your performance. The key is to separate the genuinely useful metrics from the superficial vanity metrics that look good on paper but don't drive your business forward.
Think of it this way: your metrics tell a story in three parts. By looking at them in sequence, you can follow a customer's entire journey with your brand on social media, from their first glance to their final action.
Part 1: Awareness — How Many People Are You Reaching?
This is the top of the funnel. Before anyone can engage or buy, they have to see you. Awareness metrics tell you how far and wide your message is traveling.
- Reach: This is the simplest one. It's the total number of unique people who laid eyes on your post. If 100 different accounts saw your content, your reach is 100. It’s the true size of your audience for that specific post.
- Impressions: This is the total number of times your content was shown on a screen. One person might see your post in their feed three separate times. That counts as 1 reach but 3 impressions. If your impressions are way higher than your reach, it means the same people are seeing your content over and over.
- Audience Growth Rate: This is simply the pace at which you're gaining new followers. A healthy, consistent growth rate is a great sign that your brand is capturing new interest.
Part 2: Engagement — Is Anyone Actually Listening?
Okay, people see your content. Now what? Do they care? Do they react? Engagement is where you measure the connection you're building. High engagement tells you that your content isn't just noise—it's hitting the mark.
Engagement is the currency of social media. It's the proof that your audience isn't just passively consuming your content—they are actively participating in the conversation your brand is starting.
To really get a handle on this, check out our guide to the most important social media metrics you should be tracking. The big ones are likes, comments, shares, and saves. A share, in particular, is a huge vote of confidence. It means someone liked your content enough to put their own name on it and pass it along.
Part 3: Conversions — Are People Taking the Next Step?
This is where the rubber meets the road. Conversions tie your social media work directly to your business goals. These metrics track the specific, valuable actions people take after seeing your content, proving that your strategy is delivering a real return on investment (ROI).
- Click-Through Rate (CTR): Of all the people who saw your post, what percentage actually clicked the link? A strong CTR means your image, copy, and call-to-action all worked together to make someone curious enough to click.
- Cost Per Conversion: If you're running ads, this is a critical number. It tells you exactly how much money you had to spend to get someone to complete a specific action, like signing up for a newsletter or downloading an ebook.
- Conversion Rate: This is the ultimate test. It’s the percentage of people who clicked your link and then went on to complete the goal, like making a purchase. This metric shows whether your social media efforts are actually driving sales and leads.
To help you connect these metrics to your goals, we've put together a simple table that shows which numbers to watch for different business objectives.
Essential Social Media Metrics by Goal
| Business Goal | Primary Metric | What It Measures | Example Platform |
|---|---|---|---|
| Increase Brand Awareness | Reach & Impressions | How many unique users see your content and how often it's displayed. | Instagram, Facebook |
| Build Community | Engagement Rate (Likes, Comments, Shares) | The level of interaction and connection your content fosters with your audience. | LinkedIn, TikTok |
| Drive Website Traffic | Click-Through Rate (CTR) | The percentage of viewers who click a link in your post to visit your site. | Twitter, Pinterest |
| Generate Leads/Sales | Conversion Rate & Cost Per Conversion | The effectiveness of your social media in driving valuable actions and sales. | Facebook Ads, Instagram Shopping |
By choosing metrics that align with your specific goals—whether that's building brand awareness or driving direct sales—you can move from just collecting data to making informed, strategic decisions.
Your Step-By-Step Analysis Framework
Alright, let's get practical. How do you actually go from a pile of numbers to smart decisions? A solid social media analysis isn't about frantically digging through data; it's a methodical process. Having a framework you can rely on takes the guesswork out of the equation and makes sure you’re always pulling out insights that actually move your strategy forward.
Think of it like building with LEGOs. You wouldn't just dump all the bricks on the floor and hope a castle appears. You follow the instructions, piece by piece. This step-by-step approach makes the whole thing manageable instead of overwhelming.
This infographic lays out the core flow, showing how you move from gathering data to creating a real strategy.
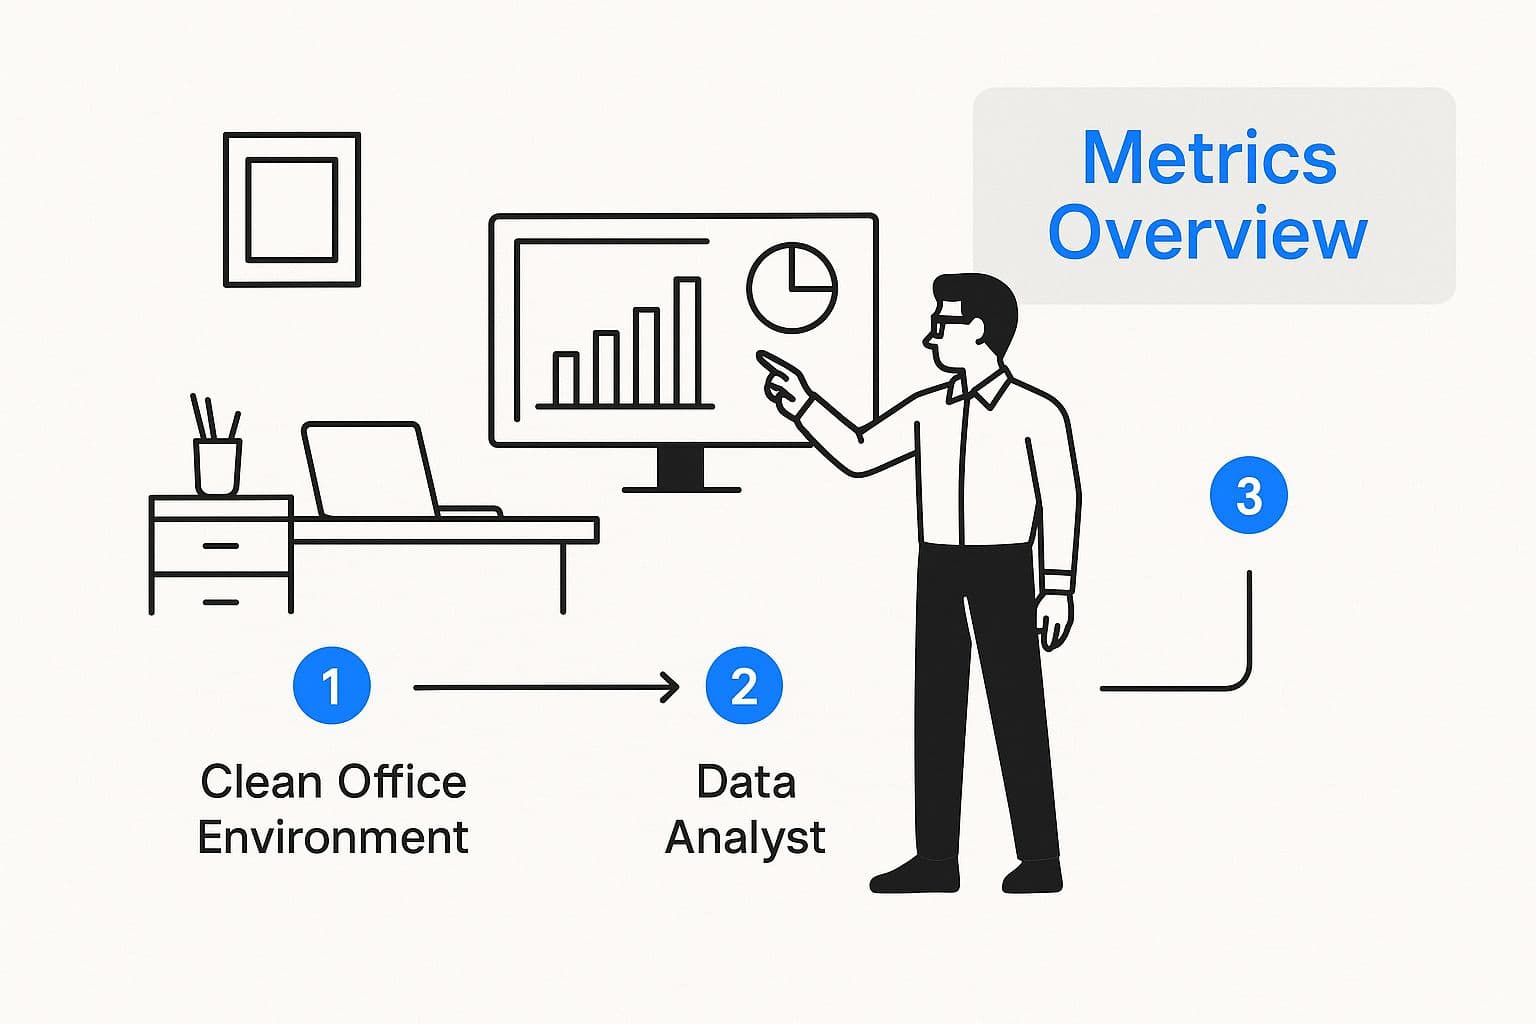
As you can see, it's a clear path from defining your goals to digging into the details of your data. Let's walk through each of those steps right now.
Step 1: Define Your Objectives First
Before you even look at a single metric, stop and ask yourself one critical question: "What am I trying to figure out?" Without a clear goal, you're just staring at numbers. Your objective is the lens you'll use to view all the data.
Are you trying to figure out if your new video strategy is hitting the mark? Then your focus will naturally be on video views, watch time, and engagement on those posts. Or maybe you're assessing a big product launch? In that case, you’ll zero in on click-through rates, conversions, and mentions tied to the new product.
Setting a clear goal from the start keeps you from drowning in data that doesn't matter. It keeps your analysis tight, focused, and efficient.
Step 2: Gather and Centralize Your Data
Once you know your "why," it's time to collect the "what." This means pulling together all the relevant data from your social media accounts. Let's be honest—manually downloading reports from Facebook, then Instagram, then LinkedIn is a massive chore. It’s not just tedious; it’s also easy to make mistakes.
This is where a tool like PostOnce can be a game-changer. It automatically pulls the data from all your connected channels into one place. This doesn’t just save you a ton of time; it also lets you see how things are going across different platforms, side-by-side, without any hassle.
Step 3: Segment Your Data for Deeper Insights
With all your information in one spot, the real work—and the fun—begins. Looking at overall account growth is a good start, but the most powerful insights are hiding a level deeper. This is where segmentation comes in. It’s all about slicing your data into smaller, specific groups to spot patterns you'd otherwise miss.
Segmentation is like using a magnifying glass on your data. Instead of seeing a blurry overview, you get a crystal-clear look at the individual components that are driving your results.
Try breaking down your data using these common categories:
- By Platform: How does engagement on Instagram stack up against LinkedIn? This shows you exactly where your audience prefers to interact.
- By Content Format: Are carousels crushing single-image posts? Do your short-form videos get more shares than longer ones? This tells you exactly what to create more of.
- By Campaign: Isolate the numbers from a specific marketing campaign to measure its direct impact on your most important metrics.
Step 4: Identify Trends and Translate to Action
The final step is all about connecting the dots. As you look through your segmented data, search for trends, patterns, and anything that stands out. Did your engagement suddenly spike after you started sharing user-generated content? Did website clicks tank when you tweaked your call-to-action?
This is the most crucial part of your social media report analysis. It's where raw observations turn into concrete, actionable steps.
For instance, if you discover that posts featuring customer testimonials have a 25% higher conversion rate, the next step is obvious: create and share more customer stories. This data-driven approach means your strategy is built on solid evidence, not just a gut feeling. It’s how you create a cycle of continuous improvement that delivers better and better results over time.
Making Your Reporting and Analysis So Much Easier with the Right Tools
Let's be honest: juggling a dozen spreadsheets and manually pulling data from every social platform is a huge time suck. It's an old-school approach that doesn't just open the door to human error—it steals your most precious resource: the time you could be spending on actual strategy and creative work.
This is where modern tools can completely change the game, turning your social media report analysis from a painful chore into a real strategic advantage. Instead of getting bogged down in data entry, a unified platform like PostOnce brings all your metrics from every channel into one clean, easy-to-read dashboard. The most mind-numbing part of reporting becomes automated, freeing you up to finally dig into the "why" behind the numbers.
The Magic of an Automated Dashboard
The single biggest win you get from a dedicated tool is efficiency. It’s that simple. When all your data is in one place, you can finally see the big picture without stitching together a Frankenstein's monster of reports. You can compare how a campaign is doing across different networks, watch your audience grow in real time, and whip up a comprehensive report in just a few clicks.
If you really want to get your process humming, it’s worth checking out guides on mastering reporting automation. Learning these techniques can slash your manual work and make your data far more reliable. This is how your team stops being data collectors and starts becoming strategic thinkers.
Platforms like PostOnce also have the added benefit of tying your content creation directly to your results. When you manage everything from one central spot, you create a seamless connection between what you post and how it performs. For more on getting your content out there effectively, take a look at our guide on https://postonce.to/blog/social-media-cross-posting. This closes the loop, allowing the insights from your analysis to directly shape what you create next.
Going Deeper: What Technology Unlocks
Modern reporting tools do a lot more than just count likes and shares. They peel back the layers of your data to reveal insights that are practically impossible to find on your own.
The real power of these tools isn't just saving time—it's gaining access to insights you wouldn't have found otherwise. They turn complex data into clear, actionable intelligence.
Here's a taste of what advanced tools bring to the table:
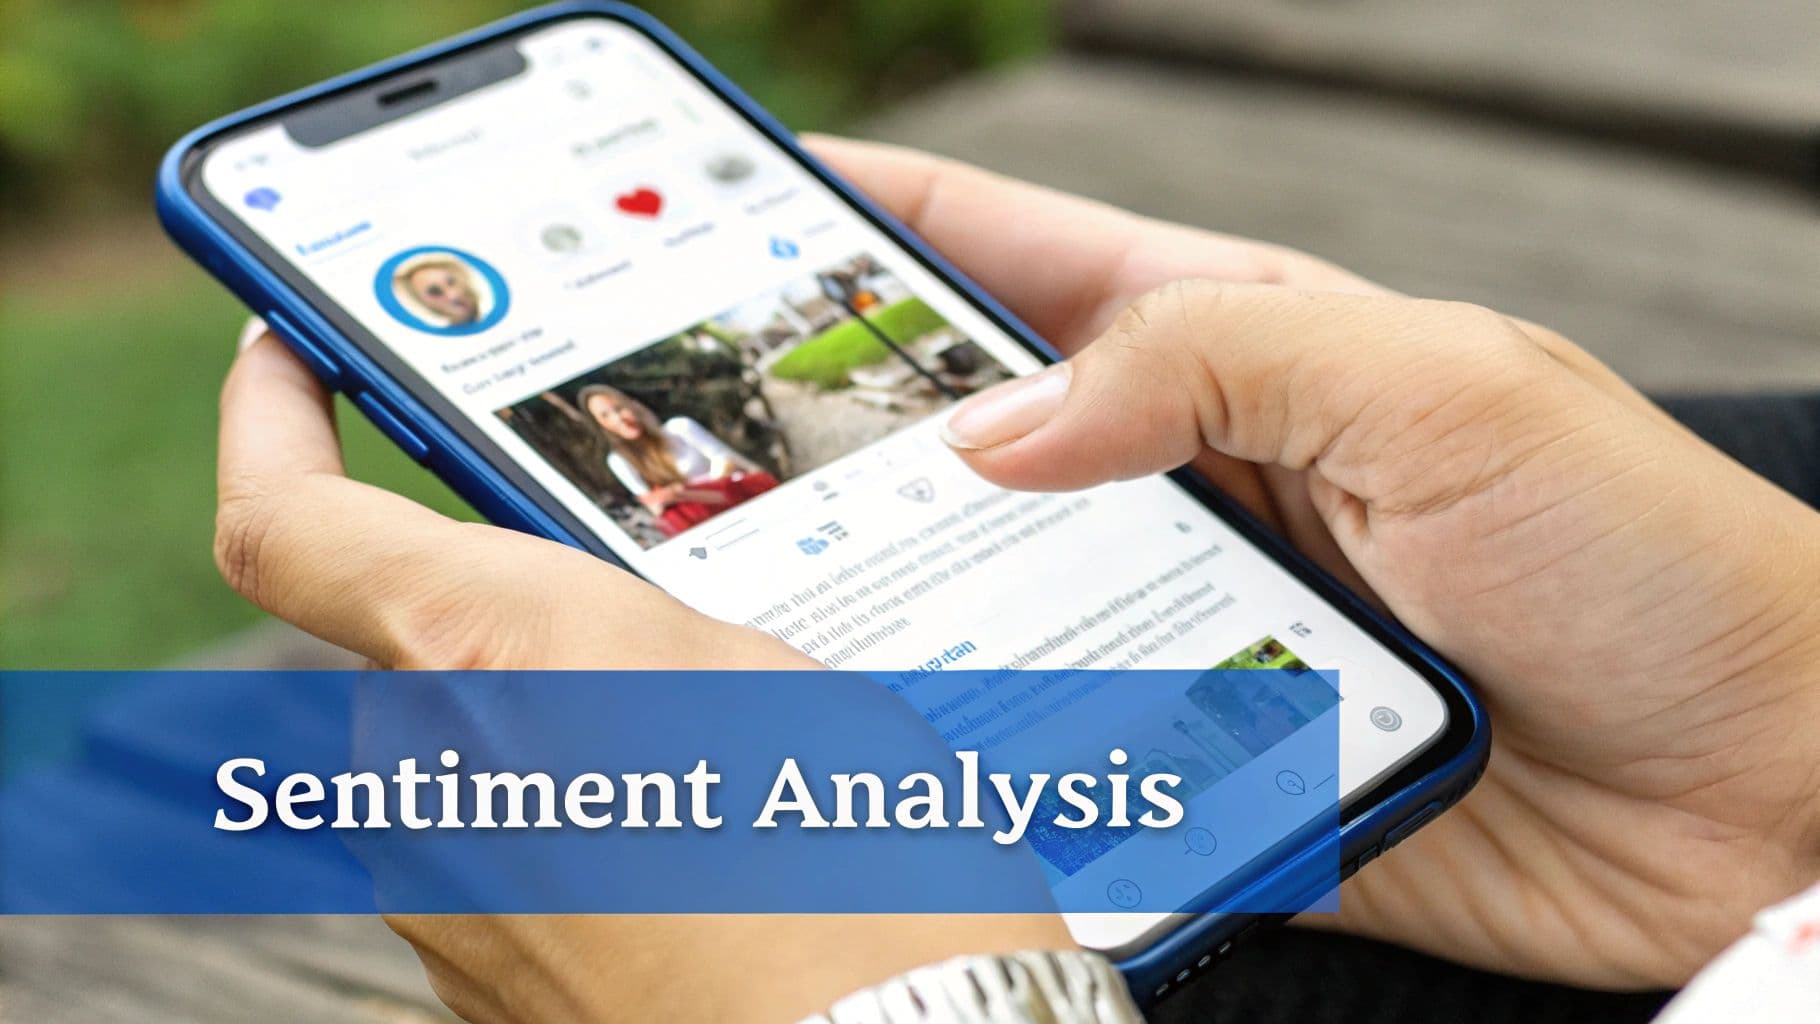
- Sentiment Analysis: This feature tells you the emotion behind your brand mentions. Are people happy, frustrated, or just neutral? That context is gold for managing your brand’s reputation.
- Competitive Benchmarking: You can automatically track how you stack up against your key competitors. No more building complicated spreadsheets to see where you're winning and where you're falling behind.
- AI-Powered Predictions: The next wave is all about predictive analytics. AI is starting to look at your past performance to forecast future trends, helping you make smarter, more proactive decisions instead of just reacting.
The results speak for themselves. A staggering 73% of businesses using AI to help with their content see real bumps in engagement. Embracing these tools doesn't just make you faster; it equips you to conduct a far more sophisticated and impactful social media report analysis.
Common Analysis Mistakes and How to Avoid Them

Having the right data is only half the battle. Knowing how to interpret it is where the real magic happens. A solid social media report analysis depends entirely on sidestepping common pitfalls that can easily send your strategy down the wrong path. In fact, a bad analysis is often worse than no analysis at all because it convinces you to put your resources in all the wrong places.
One of the biggest traps is getting fixated on vanity metrics. Sure, chasing likes and piling up followers feels great, but these numbers rarely translate to actual business goals. Think about it: a post with 1,000 likes but zero website clicks is far less valuable than one with 50 likes that brought in five new customers.
Another classic mistake is treating all social platforms the same. Engagement on a professional network like LinkedIn is a completely different beast than it is on TikTok. Just comparing follower growth or share counts across platforms without understanding their unique audiences and content styles is like comparing apples and oranges. It just doesn't work.
Developing a Critical Eye for Data
So, how do you avoid these traps? It all comes down to building a more critical mindset when you look at your numbers. Start by giving every piece of data some context. Don't just report that reach went up by 10%; explain why you think it happened. Was it that new video series you tried? A specific campaign that took off? Or maybe you just started posting more often?
The goal of analysis is not just to report numbers but to explain the story behind them. Always ask "so what?" for every metric you track to ensure it connects back to a larger business goal.
Here are a few practical ways to keep your analysis sharp and on point:
- Focus on Business Goals: Always, always tie your social media metrics back to concrete business outcomes. We're talking about things like lead generation, website traffic, and sales. This is how you make sure you’re measuring what actually drives growth.
- Segment Your Reporting: Break down your analysis for each platform. What kills it on Instagram might completely flop on LinkedIn. Recognizing these differences is the key to creating a winning strategy for every channel you're on.
- Benchmark Your Performance: Look at your results next to your own past performance, but don't stop there. Compare them to industry benchmarks, too. This gives you the context you need to know if you're truly knocking it out of the park or just running with the pack.
Ultimately, good analysis is just a tool for making smarter decisions. If you’re looking to sharpen your overall approach, our guide full of social media management tips has plenty of practical advice you can use today. By sidestepping these common mistakes, you can be confident that your conclusions are solid and your strategy is built for success.
How to Tell a Compelling Story with Your Data
You’ve done the heavy lifting—you’ve gathered the data, crunched the numbers, and dissected the metrics. But the job isn't over. In fact, the most important part is just beginning: telling a story with what you’ve found.
Data on its own is just noise. It's your job to translate those numbers into a narrative that makes sense and proves the value of your work. You need to show your boss, your clients, or your team that your social media strategy isn't just busywork; it's driving real business results. This is how you turn a dry report into a powerful tool for proving your worth.
Start with a Sharp Executive Summary
Let’s be honest—your stakeholders are busy. The very first thing they read needs to get straight to the point. Think of your executive summary as the movie trailer for your report. It should immediately highlight the most important findings and key takeaways.
A great summary quickly answers three simple questions:
- What were we trying to achieve? (e.g., Build awareness for our new product line.)
- What actually happened? (e.g., We boosted our reach by 20% and saw a 15% lift in engagement.)
- So, what's next? (e.g., We should double down on video content since it drove the highest engagement.)
This sets the stage for everything that follows, ensuring that even if someone only has 60 seconds, they walk away with the main message.
Weave a Narrative Around Your Insights
Now it’s time to flesh out the story. Instead of just listing off metrics one by one, group them together to show how your actions led to specific results. You're connecting the dots for your audience.
Don’t just state the fact:
"Our engagement rate increased by 15% this month."
Instead, tell the full story behind it:
"Our new short-form video strategy really clicked with our audience, sparking a 15% increase in engagement. Even better, that spike in interaction translated into a 5% boost in website traffic from social media, directly tying our content to the goal of bringing more potential customers to our site."
See the difference? This approach shows you’re not just posting randomly. You’re running a deliberate strategy that delivers tangible outcomes and demonstrates the real ROI of your work.
Context Is Everything
Your data doesn't exist in a vacuum. To give it real meaning, you have to frame it correctly. By 2025, people are projected to spend about 2 hours and 24 minutes on social media every day, and in the U.S., they check their phones an average of 159 times daily. You're fighting for a tiny slice of that attention. Highlighting this reality helps stakeholders understand the challenge—and the true significance of your wins. You can discover more insights about social media usage to paint a clearer picture.
Comparing your results to industry benchmarks or your own past performance adds another crucial layer. Showing that your 10% follower growth is double the industry average suddenly transforms a "good" result into an exceptional one.
Ready to stop wrestling with spreadsheets and start telling powerful stories with your data? PostOnce automates data collection and centralizes your analytics in one intuitive dashboard, giving you back the time to focus on strategy and prove your impact. Simplify your workflow and amplify your reach at https://postonce.to.