Creating compelling content is only half the battle. To truly succeed, you need to know what’s working, what’s falling flat, and why. That’s where content marketing metrics come in. They are the essential data points that transform your content strategy from a guessing game into a predictable growth engine. Without them, you're essentially operating in the dark, pouring resources into activities without understanding their true impact on your business goals.
Measuring the right metrics provides a clear roadmap for improvement. It tells you which topics resonate with your audience, which channels drive the most valuable traffic, and how your efforts translate into tangible business outcomes like leads and sales. This guide moves beyond vanity numbers to focus on the indicators that signal real success. For a deeper understanding of how to measure the success of your content initiatives, consider this resource on content marketing analytics.
We will break down the most critical metrics you should be tracking, explaining not just what they are, but how to measure them and, most importantly, how to act on the insights they provide. From top-of-funnel awareness to bottom-line revenue, you'll learn how to connect your content directly to business growth and prove its undeniable value.
1. Organic Traffic
Organic traffic measures visitors who discover your website through unpaid, organic search engine results. This metric is a cornerstone of any effective content marketing strategy because it signifies that your content is valuable, relevant, and well-optimized enough for search engines like Google to recommend it to users. Unlike paid traffic, which stops the moment you stop paying, organic traffic represents a sustainable, long-term asset that can deliver consistent leads and customers. Monitoring these crucial content marketing metrics provides direct insight into your SEO performance and brand authority.

This metric is foundational because it reflects genuine user intent. When someone searches for a term and clicks your link, they are actively seeking a solution that your content provides, making them a high-quality visitor more likely to convert. For instance, HubSpot built its empire on this principle, generating millions of monthly organic visitors by creating comprehensive blog content that answers user questions at every stage of the buyer's journey.
How to Track and Improve Organic Traffic
Tracking organic traffic is straightforward with the right tools. Google Analytics 4 (GA4) and Google Search Console are the industry standards for monitoring this data, providing a wealth of information about which pages and keywords are driving visitors to your site.
- Set Up Your Tools: Connect your website to both GA4 and Google Search Console. GA4 will show you user behavior, while Search Console will reveal the search queries that led them there.
- Monitor Trends, Not Dips: Don't panic over daily fluctuations. Instead, focus on month-over-month and year-over-year growth to understand your true performance trajectory.
- Segment Your Data: Analyze organic traffic by landing page, topic cluster, or content format (e.g., blog posts vs. case studies) to identify what resonates most with your audience.
- Target Long-Tail Keywords: As demonstrated by Buffer, which increased its organic traffic by 158%, focusing on highly specific, long-tail keywords can attract a more qualified and motivated audience. Small businesses can especially benefit from this targeted approach; learn more about content marketing for small business to see how.
2. Time on Page/Dwell Time
Time on Page, often discussed alongside Dwell Time, measures the average duration a user spends actively viewing a specific page. This metric is a powerful indicator of content quality and user engagement. A high Time on Page suggests your content is captivating, relevant, and successfully holds the visitor's attention. This is one of the most direct content marketing metrics for evaluating whether your content truly resonates, as it reflects user satisfaction in real-time.
This metric is critical because search engines like Google interpret longer dwell times as a signal of high-quality, valuable content, which can positively influence search rankings. When a user spends significant time on your page, they are demonstrating that it meets their needs. For example, platforms like Medium prominently display "read time" and use this data to refine their content recommendation algorithms, ensuring users are matched with articles that will keep them engaged. Similarly, SEO authority Moz found a strong correlation between longer dwell times and higher rankings for their educational content.
How to Track and Improve Time on Page
Tracking this metric is easily done through Google Analytics 4 (GA4), where it is reported as "Average engagement time." Improving it requires a strategic focus on making your content as engaging and readable as possible.
- Benchmark Your Data: Compare your average time on page against your content length. A 2,000-word article should naturally have a longer engagement time than a 500-word post. Set realistic benchmarks based on format and industry standards.
- Enhance Readability: Break up long text blocks with shorter paragraphs, subheadings, bullet points, and bold text. Incorporating visuals like images, infographics, and videos can also significantly increase engagement.
- Use Heatmaps and Scroll Tracking: Tools like Hotjar or Crazy Egg provide heatmaps to show where users are clicking and how far they scroll. Use this data to place important calls-to-action in high-visibility areas and identify where users drop off.
- A/B Test Content Formats: Experiment with different layouts, introductions, and interactive elements to see what best captures and holds audience attention. For instance, test a standard blog post against one that includes an embedded quiz or calculator to see which format drives up engagement time.
3. Social Media Shares
Social media shares track the number of times users post your content to their own social media profiles, such as on Facebook, X (formerly Twitter), or LinkedIn. This metric is a powerful indicator of audience advocacy and content resonance. When a reader shares your article, they are essentially endorsing your brand and vouching for its value to their personal network. Tracking these content marketing metrics reveals which content pieces are not just being read, but are compelling enough to inspire active promotion from your audience.

This metric goes beyond simple engagement like likes or comments; it represents true virality potential. A high share count amplifies your content's reach exponentially, exposing it to new audiences far beyond your existing followers. For example, BuzzFeed mastered this by creating emotionally driven, list-based content engineered for sharing, while Dollar Shave Club’s viral launch video was shared over 12,000 times in its first two days, demonstrating the immense power of a single, highly shareable asset.
How to Track and Improve Social Media Shares
Monitoring social shares requires dedicated tools that aggregate data from various platforms. Tools like BuzzSumo or SharedCount can track share counts for any URL, giving you insight into what content performs best and on which specific social networks.
- Create Share-Worthy Content: Focus on content that elicits a strong emotional response (humor, awe, anger) or provides immense practical value. Checklists, ultimate guides, and data-backed reports often generate high share counts.
- Optimize for Each Platform: Make sharing easy. Use social sharing buttons prominently on your pages and customize the pre-populated text and images for each platform to ensure your content looks great when shared.
- Analyze Your Top Performers: Use a tool like BuzzSumo to identify your most-shared content. Analyze its format, topic, and headline to understand the formula for your audience and replicate that success.
- Track Channel-Specific Performance: Don't just look at the total number of shares. Identify which platforms (LinkedIn, Facebook, Pinterest) drive the most shares for your content to focus your promotion efforts effectively. To dive deeper, you can learn more about social media metrics and how they connect to broader business goals.
4. Email Subscribers/List Growth
Email subscriber growth measures the rate at which your content successfully converts readers into email sign-ups, building your owned audience. This metric is a powerful indicator of content marketing ROI because an email list gives you direct, unfiltered access to your most engaged followers. Unlike social media algorithms or search engine rankings, your email list is an asset you control, making it one of the highest-converting channels available. Tracking these specific content marketing metrics reveals how well your content compels users to take the next step in their relationship with your brand.
This metric is vital because it represents a deliberate act of trust. When a visitor gives you their email address, they are inviting you into their personal space, signaling a high level of interest in what you have to say. For example, the popular newsletter Morning Brew grew its list from zero to over 4 million subscribers by creating shareable, valuable content and implementing a powerful referral program. Similarly, entrepreneur Tim Ferriss built a massive email list by consistently offering exclusive content and insights through his blog and podcast, proving that quality content is the ultimate lead magnet.
How to Track and Improve List Growth
Tracking subscriber growth is simple with any modern email service provider (ESP) like Mailchimp, ConvertKit, or ActiveCampaign. These platforms provide dashboards that show new subscribers over time, list growth rates, and even the sources of your sign-ups.
- Integrate Your Tools: Ensure your ESP is connected to your website and analytics platforms. This allows you to attribute new subscribers directly to the content that inspired them to sign up.
- Create Compelling Lead Magnets: Offer valuable resources like ebooks, checklists, or templates that are highly relevant to your content. A user reading a blog post about project management is far more likely to download a free project management template.
- Analyze Subscriber Source: Go beyond just counting new subscribers. Track which pages, content formats, or campaigns generate the most sign-ups. This data tells you exactly what kind of content to create more of.
- Optimize Your Capture Forms: Continuously A/B test your email capture forms. Experiment with different calls-to-action, button colors, form placements (e.g., pop-ups, embedded forms, slide-ins), and the number of fields to maximize your conversion rate.
5. Conversion Rate
Conversion rate measures the percentage of users who complete a desired action after interacting with your content. This action could be anything from signing up for a newsletter or downloading a whitepaper to making a purchase. It is one of the most critical content marketing metrics because it directly connects your content creation efforts to tangible business outcomes, proving the return on investment (ROI) of your strategy. Unlike vanity metrics, a high conversion rate shows your content isn't just attracting an audience; it's persuading them to act.
This metric is essential for demonstrating value to stakeholders, as it translates content views into measurable results like leads and sales. For example, Salesforce has mastered this by using highly targeted, content-driven landing pages that achieve impressive 15-20% conversion rates. Similarly, Unbounce famously improved its own landing page conversion rates by over 30% through rigorous A/B testing of headlines, copy, and calls-to-action, proving that optimization is key.
How to Track and Improve Conversion Rate
Tracking conversion rates requires setting up specific goals in your analytics platform. Tools like Google Analytics 4 (GA4), HubSpot, or dedicated conversion optimization software are indispensable for monitoring which pieces of content are driving the most valuable actions.
- Set Up Proper Goal Tracking: Define key actions as conversion events in GA4. For e-commerce businesses, understanding specific platform integrations can be crucial, and you can learn more about setting up conversion tracking for e-commerce to ensure every sale is attributed correctly.
- Use UTM Parameters: Tag your links with UTM parameters to track conversions from specific campaigns, social posts, or email newsletters. This helps you identify which channels and content pieces are your top performers.
- A/B Test Everything: Continuously test different elements of your content pages, such as headlines, button text, page layout, and imagery. Even small changes to your call-to-action (CTA) can lead to significant improvements.
- Create Funnel-Specific Content: Develop content tailored to each stage of the buyer's journey. A top-funnel blog post might aim for a newsletter signup, while a bottom-funnel case study should drive a demo request. Matching the content to user intent is crucial for maximizing conversions.
6. Brand Awareness/Share of Voice
Brand awareness measures how familiar your target audience is with your brand and its key messages. A crucial component of this is Share of Voice (SoV), which quantifies your brand's visibility compared to your competitors. These content marketing metrics are vital because they gauge your influence and authority within your industry, moving beyond simple traffic and engagement to assess your market penetration. A high share of voice means your content is successfully capturing attention and positioning your brand as a leader.
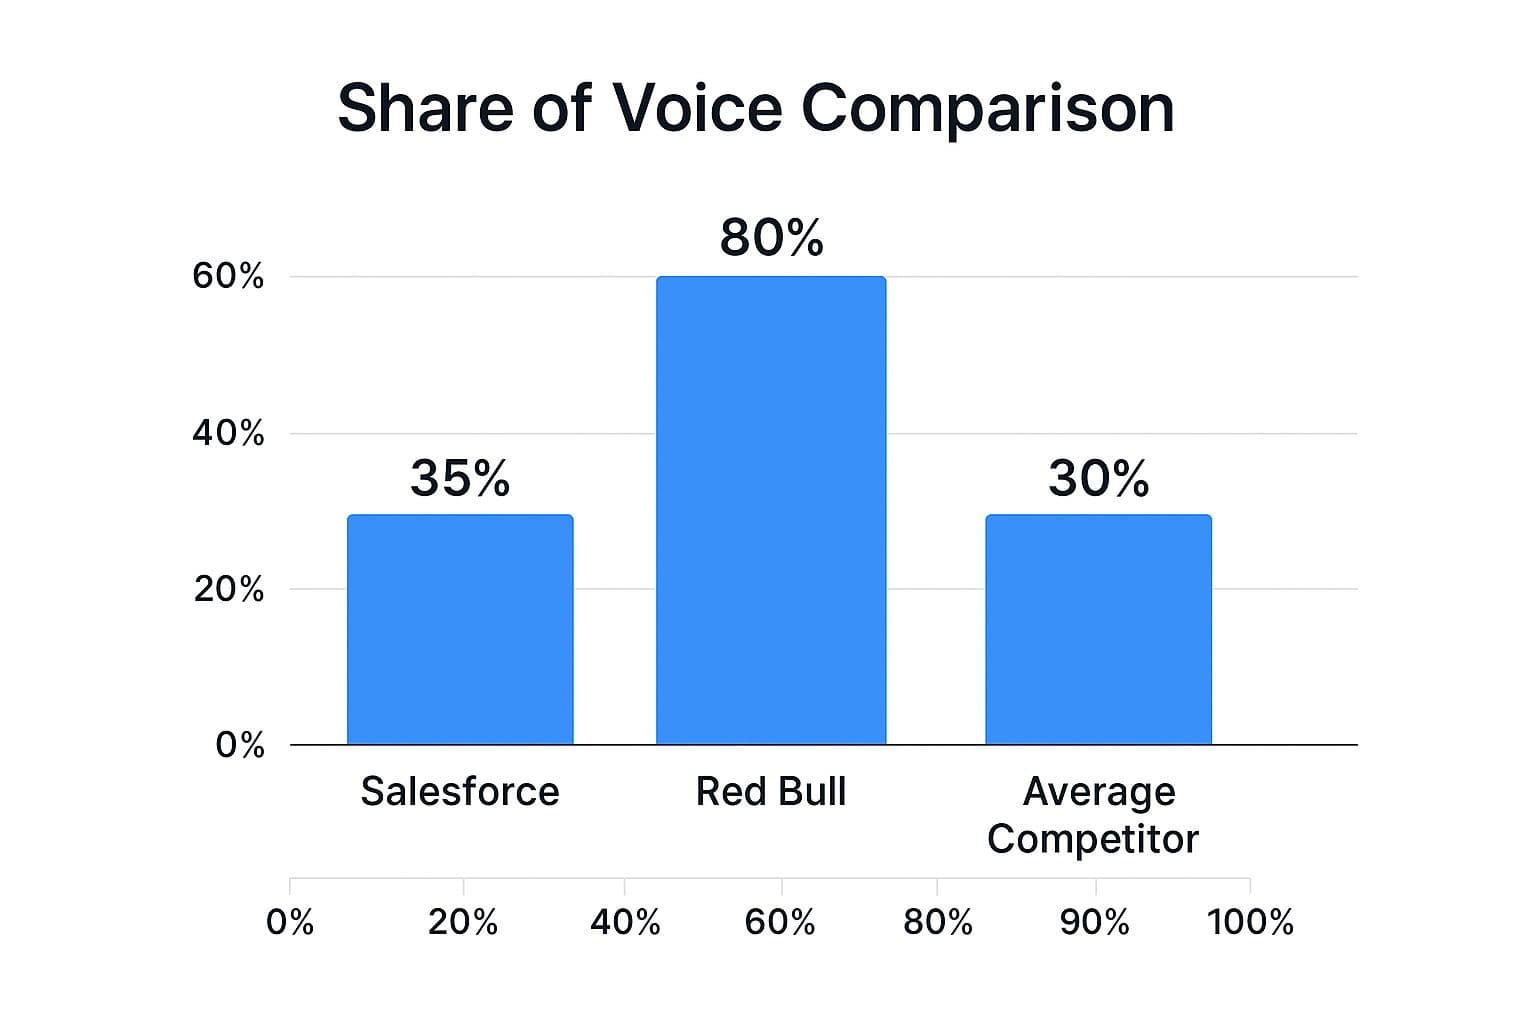
This metric is powerful because it reflects market dominance and audience preference. When your brand consistently shows up in industry conversations, it builds trust and top-of-mind recall, making it the default choice for consumers. For example, Salesforce has achieved a commanding 35% share of voice in discussions related to CRM, while Red Bull completely dominates extreme sports content marketing with an incredible 80% SoV, demonstrating how content can define an entire market category.
How to Track and Improve Brand Awareness/Share of Voice
Monitoring brand awareness requires a mix of qualitative and quantitative tools. Social listening platforms like Brandwatch or Meltwater are essential for tracking mentions and sentiment across the web, giving you a clear picture of your brand's conversational footprint.
- Use Social Listening Tools: Set up alerts to track mentions of your brand, products, and key industry terms. This allows you to monitor your share of voice in real-time and analyze the context of conversations.
- Monitor Search Volume Trends: Use Google Trends and Google Search Console to compare search volume for your branded keywords versus your non-branded, topic-focused keywords. An increase in branded searches indicates rising awareness.
- Analyze Competitor Content: Regularly audit the topics, formats, and channels your competitors are using. Identify gaps where you can create superior content to capture a larger share of the conversation.
- Survey Your Audience: Directly ask your audience about brand recall through surveys or polls. Questions like "Which brands come to mind when you think of [your industry]?" provide direct, qualitative feedback on your brand's standing.
7. Content Engagement Rate
Content engagement rate measures the level of interaction your content receives, such as likes, comments, shares, and saves, relative to your audience size. This metric is a powerful indicator of content quality and audience resonance, revealing how well your material connects with people. High engagement shows you're not just reaching an audience; you're building a community around your brand, a key goal for any list of content marketing metrics.

This metric goes beyond vanity numbers to reflect the health of your relationship with your followers. A highly engaged audience is more likely to trust your brand, share your content, and ultimately convert. For instance, Patagonia achieves exceptional engagement by aligning its content with strong brand values like environmentalism, creating a loyal following that interacts deeply with its mission. Similarly, influencers like Gary Vaynerchuk maintain high engagement by producing authentic, value-driven content that sparks conversation.
How to Track and Improve Content Engagement Rate
Most social media platforms provide native analytics dashboards to track interactions per post, but calculating the rate gives you a comparable benchmark across different channels and content types.
- Calculate Your Rate: The most common formula is (Total Engagements / Total Followers) x 100. For a more precise measure, you can use (Total Engagements / Total Reach) x 100 to gauge performance on a post-by-post basis.
- Encourage Interaction: Don't just post and pray. Use clear calls-to-action (CTAs) that ask questions, invite comments, or encourage saves. For a deeper understanding of how to effectively measure the success of your content, particularly video, you might find valuable insights in this article on Video Engagement Metrics: Your Blueprint for Content Success.
- Analyze Top Performers: Identify which content formats, topics, and styles generate the most interaction. Double down on what works and use those insights to inform your future strategy.
- Repurpose Engaging Content: If a blog post gets tons of comments, turn its key points into a carousel or video. You can discover more powerful techniques in this guide to creating a content repurposing strategy that maximizes your best-performing assets.
8. Customer Lifetime Value (CLV) from Content
Customer Lifetime Value (CLV) from content measures the total revenue a business can expect from a customer who was acquired through content marketing channels. This advanced metric goes beyond initial conversion, revealing the long-term financial impact of your content by linking it directly to customer loyalty and repeat business. Tracking these content marketing metrics demonstrates how educational content not only attracts leads but also nurtures them into high-value, long-term partners for your brand.
This metric is powerful because it shifts the focus from short-term gains to sustainable growth. A customer who finds you through a helpful blog post is often better educated and more aligned with your brand's solutions, leading to higher satisfaction and retention. For example, Salesforce discovered that prospects educated through its content became customers with a 2.3x higher CLV, proving that an initial investment in content pays dividends far beyond the first sale.
How to Track and Improve Content-Driven CLV
Calculating CLV requires connecting marketing data with sales and customer data, often using a CRM or marketing attribution platform. The goal is to isolate cohorts of customers based on their first touchpoint being a piece of your content and then tracking their spending over time.
- Implement Multi-Touch Attribution: Use a tool that can track a user's entire journey, from their first blog visit to their final purchase. This helps you accurately credit content for its role in acquiring high-value customers.
- Use Cohort Analysis: Group customers acquired in the same month via content and track their average spending over subsequent months or years. This reveals patterns in long-term value.
- Segment by Content Type: Analyze CLV based on the specific content that acquired the customer. Did customers from your webinars have a higher CLV than those from blog posts? Use these insights to double down on what works.
- Factor in Retention and Expansion: A complete CLV calculation includes not just the initial purchase but also upsells, cross-sells, and subscription renewals. This highlights content's role in creating loyal brand advocates.
Key Metrics Comparison of Top 8 Content Marketing KPIs
| Metric | Implementation Complexity 🔄 | Resource Requirements ⚡ | Expected Outcomes 📊 | Ideal Use Cases 💡 | Key Advantages ⭐ |
|---|---|---|---|---|---|
| Organic Traffic | Medium 🔄 (SEO optimization ongoing) | Moderate ⚡ (SEO tools, content creation) | Sustainable traffic growth, SEO effectiveness 📊 | Long-term content authority and growth 💡 | Free traffic, high trust, compound growth ⭐ |
| Time on Page / Dwell Time | Low-Medium 🔄 (analytics setup) | Low ⚡ (analytics tools only) | Content quality and engagement insights 📊 | Measuring user engagement and content relevance 💡 | Direct engagement measure, conversion correlation ⭐ |
| Social Media Shares | Low-Medium 🔄 (tracking & content) | Moderate ⚡ (social tools, creative content) | Content amplification and viral potential 📊 | Amplifying content reach and brand advocacy 💡 | Extends reach, builds awareness, free amplification ⭐ |
| Email Subscribers / List Growth | Medium 🔄 (lead capture and nurturing) | Moderate ⚡ (email platforms, lead magnets) | Owned audience growth and high conversion 📊 | Lead generation and direct audience communication 💡 | High conversion, owned media asset, compound value ⭐ |
| Conversion Rate | Medium 🔄 (tracking and optimization) | Moderate ⚡ (attribution tools, CRO) | Direct link to business goals and ROI 📊 | Optimizing content for sales and sign-ups 💡 | Clear ROI, budget optimization, business impact ⭐ |
| Brand Awareness / Share of Voice | High 🔄 (complex tracking & analysis) | High ⚡ (monitoring tools, competitive analysis) | Market visibility and brand positioning 📊 | Competitive benchmarking and brand building 💡 | Long-term brand strength, competitive insights ⭐ |
| Content Engagement Rate | Medium 🔄 (aggregation from platforms) | Moderate ⚡ (analytics and engagement tools) | Comprehensive content interaction insights 📊 | Understanding audience relationship across platforms 💡 | Multi-platform insights, authentic audience interest ⭐ |
| Customer Lifetime Value (CLV) from Content | High 🔄 (advanced attribution modeling) | High ⚡ (data analytics, CRM integration) | Long-term revenue impact and ROI 📊 | Strategic content investment and customer valuation 💡 | True long-term ROI, strategic budget support ⭐ |
Moving Beyond Vanity: Weaving a Narrative with Your Content Marketing Metrics
We've journeyed through a comprehensive landscape of content marketing metrics, moving from foundational indicators like Organic Traffic and Time on Page to the more nuanced and impactful measures of Customer Lifetime Value and Brand Awareness. The core takeaway isn't simply to track these numbers but to understand the intricate story they tell about your audience, your content, and your business. Treating these metrics as isolated data points is like having a box of puzzle pieces without the picture on the lid. The real power emerges when you connect them.
A spike in Organic Traffic (Metric #1) is promising, but does it correlate with a healthy Time on Page (Metric #2)? If not, your content might be attracting clicks but failing to deliver value. Similarly, a high number of Social Media Shares (Metric #3) is fantastic for reach, but are those shares translating into tangible Email Subscribers (Metric #4)? This connection reveals whether your viral content is building a loyal, owned audience or just fleeting attention. The ultimate goal is to weave these individual threads into a cohesive narrative that guides your strategy.
From Data Points to Strategic Decisions
Mastering your content marketing metrics is the definitive step from being a content creator to becoming a content strategist. It’s the difference between guessing what works and knowing precisely what resonates with your audience and drives business objectives. Instead of chasing trends blindly, you can make data-informed decisions with confidence.
Here are your immediate next steps to put this knowledge into action:
- Conduct a Metrics Audit: Choose 3-4 key metrics from this list that align directly with your primary business goal for this quarter. Is it brand awareness? Focus on Social Shares and Share of Voice. Is it lead generation? Prioritize Email Subscribers and Conversion Rate. Don't try to track everything at once.
- Establish Your Baseline: Before you can measure improvement, you need a starting point. Document your current performance for your chosen metrics. This baseline will be the benchmark against which all future efforts are measured.
- Connect the Dots: Create a simple dashboard or spreadsheet to track your chosen metrics side-by-side. Look for patterns. For example, when you publish a long-form blog post, how does it impact Time on Page, SEO rankings, and ultimately, Conversion Rate (Metric #5) for a related lead magnet?
By embracing this analytical approach, you transform your content from a cost center into a predictable, scalable growth engine. You stop throwing content at the wall to see what sticks and start building a strategic library of assets, each with a purpose, a measurable outcome, and a clear contribution to your bottom line. This is how you win in the crowded digital landscape, not by creating more content, but by creating smarter content backed by irrefutable data.
Ready to streamline your content distribution and amplify the metrics that matter? PostOnce lets you schedule and publish your content across all your social media platforms from a single dashboard, saving you time and giving you a unified view of your cross-channel performance. Stop juggling tabs and start making data-driven decisions by visiting PostOnce today.