Think of content performance metrics as the language your audience uses to tell you what they think. They’re the hard numbers—like views, shares, and click-through rates—that translate fuzzy concepts like "engagement" into concrete data you can actually use.
These metrics reveal exactly how people interact with what you create, showing you what’s hitting the mark, what’s falling flat, and most importantly, why.
Why Content Performance Metrics Matter

Putting content out there without tracking its performance is a lot like sailing without a compass. Sure, you're moving, but are you getting closer to your destination or just drifting out to sea? Content performance metrics are the navigational tools that give you the feedback you need to guide your strategy home.
These aren't just numbers to fill a spreadsheet. They tell a story about your audience: what topics catch their eye, which formats they love, and what finally convinces them to act. When you learn to read that story, you stop guessing and start making smart, data-informed decisions that produce real results.
Moving From Guesswork to Strategy
It's easy to fall into the trap of running on intuition. You might pour your heart into a blog post you think is a masterpiece, only for the data to show that most people bailed after the first paragraph. On the flip side, a quick social media update you barely thought about could explode with engagement and drive a ton of traffic.
Tracking metrics is the foundational step in transforming your content from a creative exercise into a strategic business asset. It’s how you connect effort directly to outcomes.
Without clear data, you're just gambling with your time and budget. Metrics give you the objective truth about what works, empowering you to:
- Spot your greatest hits so you can create more content like it.
- Identify the duds that need a refresh or should be retired.
- Truly understand your audience and what they want from you.
- Prove your marketing's value by showing a clear return on investment.
Different Metrics Tell Different Stories
To truly understand what's going on, you need to look at a mix of metrics. Each category gives you a different piece of the puzzle, helping you see the full picture of your content's journey.
To make this clearer, here’s a quick breakdown of what each type of metric tells you.
Key Metric Categories at a Glance
| Metric Category | What It Measures | Key Question It Answers |
|---|---|---|
| Awareness | How many people see your content. | "Is my content reaching a wide enough audience?" |
| Engagement | How people interact with your content. | "Does my audience actually care about this?" |
| Conversion | How many people take a desired action. | "Is my content driving business goals?" |
| Loyalty | How many people keep coming back for more. | "Are we building a dedicated community?" |
By looking at these categories together, you can diagnose issues and build on your successes with confidence.
The Power of Starting Simple
Even the most basic metrics can offer powerful clues. Take something as simple as 'page views.' It just counts how many times a page was loaded, but a sudden spike can signal a trending topic or a wildly successful promotion. It’s a direct indicator of broad audience interest.
Of course, page views are just the first step. The real magic happens when you start combining different data points to get a richer understanding. To go deeper, exploring key SEO performance metrics can show you how your content's performance impacts search rankings.
By analyzing metrics across traffic, engagement, and conversions, you can stop wondering what works and start knowing. This allows you to double down on your wins and ensure every single piece of content you create serves a clear purpose.
A Simple Framework for Tracking Metrics
Jumping into the world of content performance metrics can feel like trying to drink from a firehose. There's just so much data coming at you, and it's easy to get lost in a sea of numbers. A better approach is to organize everything into a simple, logical framework.
Think of it like building a house. You can't start with the roof. You need a foundation first, then the walls, and finally, the roof to tie it all together.
I like to break metrics down into three tiers, with each one building on the last:
- Consumption Metrics: Did people see my content?
- Engagement Metrics: Did they interact with it?
- Conversion Metrics: Did it drive business results?
This layered approach helps you tell a complete story, from the first impression your content makes all the way to its impact on your bottom line. Let's dig into each tier.
Tier 1: Consumption Metrics
Consumption metrics are your foundation. They answer the most fundamental question of all: "Is anyone out there?" These numbers are all about your content's basic reach and visibility.
Imagine you're handing out flyers for a new local event. The very first thing you’d want to know is how many people actually took one from you. That's exactly what consumption metrics do for your digital content.
Common consumption metrics include:
- Page Views: The total number of times your content was loaded.
- Unique Visitors: The number of distinct individuals who saw your content.
- Impressions: How many times your content was displayed on a screen, whether it was clicked or not.
- Reach: The total number of unique people who saw your post in their social media feed.
These are what we call top-of-funnel numbers. A high page view count is a good start, but it doesn't tell you if people actually read or valued what they saw. It simply confirms your content is getting in front of eyeballs.
The image below shows how these essential metrics build on one another, from initial traffic to the final sale.
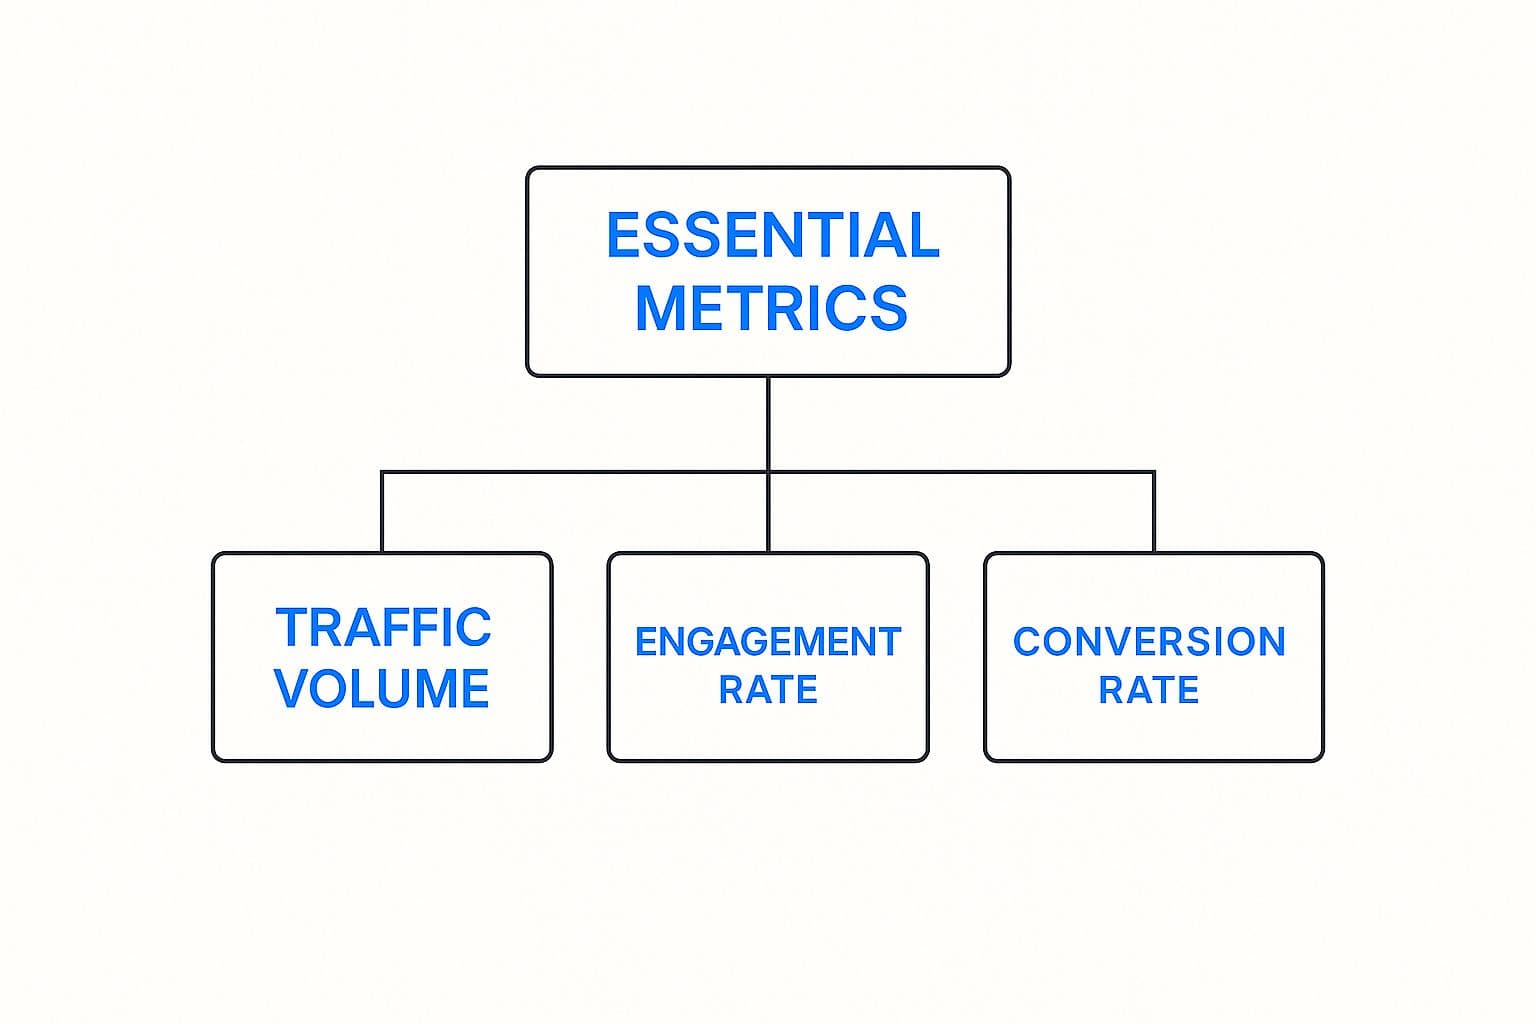
As you can see, you first have to attract an audience (Traffic) before you can measure how they interact (Engagement) and what actions they take (Conversion).
Tier 2: Engagement Metrics
Okay, so people are seeing your content. The next logical question is, "Do they even care?" This is where engagement metrics come into play. They measure how your audience is actively interacting with what you've created, which is a fantastic signal of genuine interest.
Going back to our flyer analogy, engagement is about how many people stopped to actually read it, ask you a question about the event, or even show it to a friend. These metrics add much-needed context to your raw traffic numbers.
A ton of traffic with very low engagement is a huge red flag. It usually means your headline or image was great, but the content itself didn't deliver on its promise.
Key engagement metrics to watch are:
- Time on Page: How long are visitors actually sticking around?
- Scroll Depth: How far down the page are they scrolling?
- Shares, Likes, and Comments: Classic social interactions that prove your content is resonating.
- Click-Through Rate (CTR): The percentage of people who click a link within your content.
Analyzing these helps you figure out what truly connects with your audience and what falls flat.
Tier 3: Conversion Metrics
Finally, we have conversion metrics. This is the roof of your house—the part that provides real, tangible value by tying your content directly to business goals. These numbers answer the million-dollar question: "Is my content actually working?"
This is where your content's ROI becomes crystal clear. When you're tracking performance, it's crucial to understand a range of key marketing metrics like CTR, CVR, LTV, and AOV to get the full financial picture.
Essential conversion metrics include:
- Leads Generated: How many new contacts did you capture?
- Form Submissions: The number of people who signed up for your newsletter or requested a demo.
- Sales Revenue: Direct income you can attribute to a specific piece of content.
- Conversion Rate (CVR): The percentage of visitors who took the action you wanted them to take.
By tracking all three tiers, you create a powerful feedback loop. You can clearly see how initial reach turns into audience interest, and how that interest ultimately drives meaningful results for your business.
Measuring Real Audience Engagement

Think of it like this: consumption metrics like page views tell you how many people showed up to your party. But they don't tell you if anyone actually stayed to chat, danced, or had a good time. That’s where engagement metrics come in. They look past the raw traffic numbers to show you how your audience is really connecting with what you’ve created.
Drilling down into these content performance metrics is what separates a brand that gets fleeting clicks from one that builds a genuinely loyal community. A massive view count with terrible engagement is a classic red flag. It usually points to clickbait—a headline that made a promise the content couldn't keep. True success means capturing and holding your audience's attention.
Beyond the Click: Metrics That Signal a Real Connection
To figure out if people are genuinely interested, you have to look at what they do after they arrive. These actions are clear signals about your content's quality, its relevance, and its ability to keep someone locked in.
A simple page view is just someone glancing in your shop window as they walk by. An engaged user is someone who walks inside, browses the aisles, and actually spends time looking at what you have to offer. That's a world of difference.
Key engagement metrics you should be watching include:
- Average Time on Page: This is exactly what it sounds like—how long, on average, a visitor sticks around. A higher number is a great sign that your content is compelling enough to command focus.
- Scroll Depth: This one is crucial. It shows you how far down the page people are actually scrolling. If most visitors bail after seeing only the top 25%, you might have an issue with your intro or the content just isn't what they expected.
- Comments, Likes, and Shares: These are the most obvious forms of social proof. They show that your content is sparking conversations and hitting a nerve, either emotionally or intellectually.
These numbers tell a much richer story than traffic alone. They help you diagnose why one piece of content is a hit while another is a dud, giving you real insights to improve your entire strategy.
The Power of Engaged Time
One of the most telling indicators of all is Average Engaged Time. This metric is a game-changer because it goes a step beyond just "time on page." It specifically measures how long a user is actively interacting with your content—scrolling, clicking, or even just moving their mouse. It cleverly filters out all that idle time when your page is just sitting open in a background tab.
Engaged time is a powerful proxy for content quality. It directly reflects how captivating and valuable your audience finds your material, separating passive views from active readership.
This focus on active interaction is quickly becoming the new gold standard. You can see this shift in how modern analytics platforms are built. For instance, Chartbeat's Historical Dashboard doesn't just show page views; it pairs them with metrics like 'total engaged minutes.' This gives creators a much clearer, long-term picture of how actively visitors are consuming their work, moving the goalposts far beyond simple clicks.
Turning Engagement Data into Smarter Content
Tracking engagement metrics isn't just for spreadsheets and reports; it's about gathering intelligence to make your content undeniably better. When you analyze this data, you can stop guessing and start making informed decisions. For a full rundown of what to track, check out our guide on the 8 essential content marketing metrics to track in 2025.
Here’s how you can use this data to start refining your work today:
- Low Time on Page? Your intro probably isn't grabbing the reader, or the content itself doesn't deliver on the headline's promise. Try rewriting your opening to be more direct and compelling.
- Poor Scroll Depth? Your content might be a giant wall of text. People hate that. Break it up with subheadings, images, and bullet points to make it easier on the eyes.
- Few Social Shares? The content might be a bit dry or not practical enough for someone to feel compelled to share it. Try adding more actionable tips or a stronger, more distinct point of view.
Of course, your content lives on other platforms, too, so knowing how to measure social media engagement is also a key piece of the puzzle. By paying close attention to all these signals, you can fine-tune everything from your content's length to its tone, ensuring you serve your audience better and keep them coming back for more.
How Site Speed Affects Your Content
Imagine you’ve just created your masterpiece—the perfect blog post, a beautiful landing page, or a game-changing guide. You've poured hours into every word and pixel. But what if most of your audience never even sees it? That’s exactly what happens when your website is slow. Site speed is the unsung hero of content performance, and ignoring it can make all your hard work vanish into thin air.
Let's use an analogy. Think of your website as a physical store. Your incredible content is the amazing product on the shelves. But if the front door is stuck and takes ages to open, potential customers will just walk away frustrated. It doesn’t matter how great the product is if they can't get inside to see it. Our online attention spans are incredibly short; we simply won't wait.
Even a small delay can have an outsized impact on your content performance metrics. This isn't just about a few annoyed visitors. We're talking about a direct blow to your conversions, your brand's credibility, and your bottom line. A slow site tells your audience you don’t respect their time, and that’s a quick way to lose them for good.
The Connection Between Speed and Engagement
The relationship between a fast website and an engaged audience is crystal clear. When a page snaps into view, visitors feel welcome. They’re far more likely to stick around, read your content, and see what else you have to offer. That first impression sets the tone for their entire journey with your brand.
A slow-loading page does the exact opposite—it immediately creates a roadblock. With every passing millisecond, the odds of a visitor hitting the "back" button climb higher. That's what we call a bounce, and a high bounce rate is a flashing red light, signaling that technical issues are sabotaging your content.
Your site’s performance is the invisible gatekeeper of your content. No matter how great your content is, it can’t succeed if users abandon the page before it even finishes loading.
This isn't just a hunch; the numbers don't lie. Website performance is a cornerstone of user experience, and metrics like page load time have a direct, measurable effect. For instance, a delay of a single second can drop customer satisfaction by 16% and sink conversion rates by as much as 7%. If you want to dig deeper into the data, you can explore more about website performance metrics and see just how powerful the connection is.
Key Technical Metrics That Matter
To give your content the fighting chance it deserves, you need to keep an eye on a few technical numbers. You don’t need a degree in computer science to get a handle on them, but knowing what to look for is the first step toward building a better experience for your audience.
Here are the big ones to watch:
- Page Load Time: This is the total time it takes for your entire page to load and become usable. The magic number? You should be aiming for under 2-3 seconds.
- Time to First Byte (TTFB): This one measures how quickly your server responds to a request. If your TTFB is slow, it’s often a sign that your web hosting or server setup needs a tune-up.
- Bounce Rate: As we covered, this is the percentage of people who land on your page and leave without clicking anything else. A high bounce rate is a classic symptom of a slow site.
Keeping these metrics in check helps you spot problems before they turn visitors away. Plus, search engines like Google reward sites that provide a fast, smooth experience. A slow website won't just frustrate users; it can actively hurt your search rankings, making your content harder to find. When you build on a solid technical foundation, you finally let your brilliant content do what it was meant to do.
Tracking Your Success on Social Media

While website metrics give you a clean look at performance on your own turf, social media is a whole different ballgame. Each platform—from Instagram and LinkedIn to Facebook and Threads—has its own audience, its own vibe, and its own unspoken rules for what works. The content performance metrics here aren't about technical details like page speed; they're about human connection.
Think of your social media content like a conversation starter at a giant, bustling party. You toss out an idea, a story, or a question, and the metrics tell you exactly how the crowd reacts. Who stopped to listen? Who jumped into the discussion? And who liked it so much they had to tell their friends? That's what social media metrics really answer.
Nailing this is fundamental to building a real presence. You can't just spray the same message everywhere and cross your fingers. You have to listen to the specific feedback each platform gives you to genuinely connect with people.
The Metrics That Define Social Interaction
On social platforms, the game shifts from just getting views to inspiring action. A "view" is only the first step. What really matters is the reaction it sparks. These metrics are your direct line to understanding what actually resonates with your followers.
Let’s break down the most vital signs of social media success:
- Reach: This is the number of unique people who actually saw your post. It's your starting point—how many individuals you managed to get your message in front of.
- Impressions: This is the total number of times your post was shown to someone, clicked or not. If your impressions are much higher than your reach, it means your followers are seeing your content multiple times.
- Engagement Rate: This is arguably the king of social metrics. It’s a formula that typically measures your likes, comments, and shares against your reach or follower count. A high engagement rate is the clearest sign that your content is hitting home.
- Shares or Retweets: This is a huge vote of confidence. When someone shares your content, they’re putting their own reputation on the line to endorse it to their network. They’re becoming a genuine advocate for your brand.
These numbers give you instant feedback on every single thing you post, helping you learn what your audience loves in real time.
Connecting Social Activity to Business Goals
While likes and shares are fantastic for reading the room, the ultimate goal is to tie your social media work back to real business results. This is where referral traffic becomes a mission-critical metric. Referral traffic tells you how many people land on your website by clicking a link from one of your social media posts or your profile bio.
Social media engagement is the engine, but referral traffic is the bridge that connects that engine to your business goals. It’s how you turn followers into potential customers.
By keeping an eye on this, you can pinpoint exactly which platforms are sending the most valuable visitors to your site. This data is gold when it comes to justifying your investment in social media and proving a clear return. For example, you might find that LinkedIn sends a small but highly qualified stream of traffic that converts, while Instagram sends a flood of visitors that's perfect for building brand awareness.
For a much deeper dive into the specific numbers that drive success, our guide on mastering the social media metrics that matter lays out the complete roadmap.
Using Platform-Specific Insights
Every social media platform offers its own built-in analytics dashboard, and getting comfortable with this data is a must. These tools reveal who your audience is (their demographics), when they're most active, and which of your content formats are knocking it out of the park.
For instance:
- Instagram Insights might show you that your Reels are getting 10x the reach of your static image posts.
- LinkedIn Analytics could reveal that your text-only posts with a great hook are sparking far more comments than posts with links.
- Facebook Insights can tell you the specific age and location of the people who engage with your content the most.
When you pay close attention to these platform-specific content performance metrics, you stop guessing and start creating content that’s perfectly tuned for each channel. This tailored approach is what transforms a scattered social media presence into a strategic and powerful growth machine.
Building Your Content Performance Dashboard
Gathering data is the easy part. The real challenge is making sense of it all and turning those numbers into smart decisions. That’s exactly what a content performance dashboard is for. Forget about intimidating spreadsheets filled with endless rows of data; think of it more like your content strategy’s mission control. It's a single screen that brings your most critical numbers together, giving you the big picture at a single glance.
Instead of drowning in dozens of different metrics, a well-built dashboard cuts through the noise and focuses your attention on the signals that actually move the needle. It should tell you a clear story: which pieces are resonating with your audience and which ones are just taking up space. This isn't about reporting for the sake of reporting. It's about creating a living tool that guides your every move and helps you consistently create more of what works.
Selecting Your Core Metrics
The secret to a truly useful dashboard? Simplicity. You don’t need to track every metric available. The goal is to pick a handful of core indicators from each key category that, together, give you a balanced and holistic view of your performance. A great way to start is by choosing one primary and one secondary metric for each area you care about.
Here’s a simple framework to get you thinking:
- Consumption: Are people seeing your content?
- Primary Metric: Unique Page Views
- Secondary Metric: Top Traffic Sources
- Engagement: Is your audience actually interacting with it?
- Primary Metric: Average EngEngaged Time
- Secondary Metric: Social Shares
- Conversion: Is it helping you achieve your business goals?
- Primary Metric: Lead Generation (like email sign-ups)
- Secondary Metric: Click-Through Rate (CTR) on your main calls-to-action
- Technical: Is your website experience helping or hurting performance?
- Primary Metric: Page Load Time
- Secondary Metric: Bounce Rate
This balanced approach stops you from chasing vanity metrics. You won't just celebrate high page views if you know those visitors aren't engaging or converting into customers.
A great dashboard should answer your most important questions in seconds. If you have to spend ten minutes trying to figure it out, it’s not working. The entire point is to create clarity, not more complexity.
Once you’ve settled on your metrics, it's time to build. You don't need expensive software to get started. Powerful tools like Google Analytics and Google Search Console are completely free and can track most of this data for you. You can even create custom dashboards right inside Google Analytics to pull these specific numbers into one convenient report.
Essential Metrics for Your Reporting Dashboard
Let's make this more concrete by looking at what a simple, effective dashboard might look like. When you organize your data this way, you can spot trends and compare performance across the different pillars of your strategy almost instantly.
Here's a sample template showing how you could structure your dashboard to get a comprehensive view of your content's performance.
| Category | Primary Metric | Secondary Metric | Tool to Use |
|---|---|---|---|
| Consumption | Unique Page Views | Traffic Source | Google Analytics |
| Engagement | Average Engaged Time | Social Shares | Google Analytics / PostOnce |
| Conversion | Form Submissions | CTR on CTAs | Google Analytics / HubSpot |
| Technical | Page Load Time | Bounce Rate | Google Search Console |
This structure turns raw data into a real story. Imagine you see a blog post with sky-high Unique Page Views from organic search but a terrible Bounce Rate and a low Average Engaged Time. That tells you something specific and actionable: your SEO is on point, but the content itself isn't grabbing the reader. You instantly have a clear area to focus on for improvement.
Ultimately, a great dashboard doesn't just show you what happened; it gives you powerful clues about why. It also shines a spotlight on your best-performing content, giving you the perfect starting point for an effective content repurposing strategy to get even more mileage from your proven winners.
A Few Common Questions, Answered
Diving into content performance metrics can feel a bit overwhelming at first. It's totally normal to have questions as you start connecting the dots between data and real-world results. Let's walk through some of the most common ones I hear from people just like you.
What If I'm Working with a Tiny Budget?
This is a big one, but I have good news: you don't need a huge budget to get meaningful insights. In fact, some of the most powerful tools out there won't cost you a penny.
- Google Analytics: This is the gold standard for a reason. It's a free, incredibly deep tool that shows you who is visiting your website, how they found you, and what they do once they're there.
- Google Search Console: Think of this as your direct line to Google. It tells you exactly how your content shows up in search results, including impressions, clicks, and your average position.
- Built-in Social Analytics: Every platform, from Instagram and Facebook to LinkedIn, has its own free analytics dashboard. This is where you'll find all your essential reach and engagement data.
By piecing these together, you can create a surprisingly sophisticated tracking system. The trick is to start small and focus on the handful of metrics that matter most to your goals, rather than trying to track everything at once.
Can You Explain Leading vs. Lagging Indicators?
Absolutely. This distinction is key to understanding what your data is actually telling you. It's a lot like monitoring your health.
A lagging indicator is like stepping on the scale. It shows you the outcome of your past actions—the result of last month’s diet and exercise. A leading indicator is like tracking your daily calorie intake or how many workouts you did this week. It predicts the future outcome.
In the world of content, it breaks down like this:
- Lagging Indicators: These are your outcome metrics, the results of your hard work. Think New Customers acquired or Total Form Submissions. They tell you what you achieved.
- Leading Indicators: These are your in-progress metrics. Things like Average Time on Page or a high Engagement Rate strongly suggest you're on the right path to hitting those bigger goals down the line. They tell you if you're on track.
How Often Should I Actually Check My Metrics?
It's easy to get addicted to refreshing your analytics, but that's not a great use of your time. You need a rhythm. Trying to analyze everything every day will just lead to burnout and knee-jerk reactions.
Here’s a practical schedule that works for most people:
- Daily or Weekly: Keep an eye on your leading indicators. A quick glance at social media engagement or real-time traffic helps you catch any big wins or sudden problems right away.
- Monthly: This is when you sit down and review your core content performance metrics. Look at your traffic sources, conversion rates, and which pieces of content were the true standouts. This gives you the bigger picture.
- Quarterly: Zoom all the way out. This is your strategy session. Are you actually hitting the major goals you set? Based on three months of data, you can make informed decisions about what needs to change.
Ready to stop juggling platforms and start automating your social media? With PostOnce, you can create content once and distribute it everywhere, perfectly formatted for each network. Start saving time and amplifying your reach with PostOnce.